Pollution in New Jersey doesn't fall on everyone equally, and this project shows where it lands and on whom.

SoilStory is my research project: I analyze public data on New Jersey's air, water, heat, and toxic sites, publish the code behind every figure, and collect stories from the people most affected.

Hands of many skin tones reaching toward a globe

Latest From the Field

View all research →
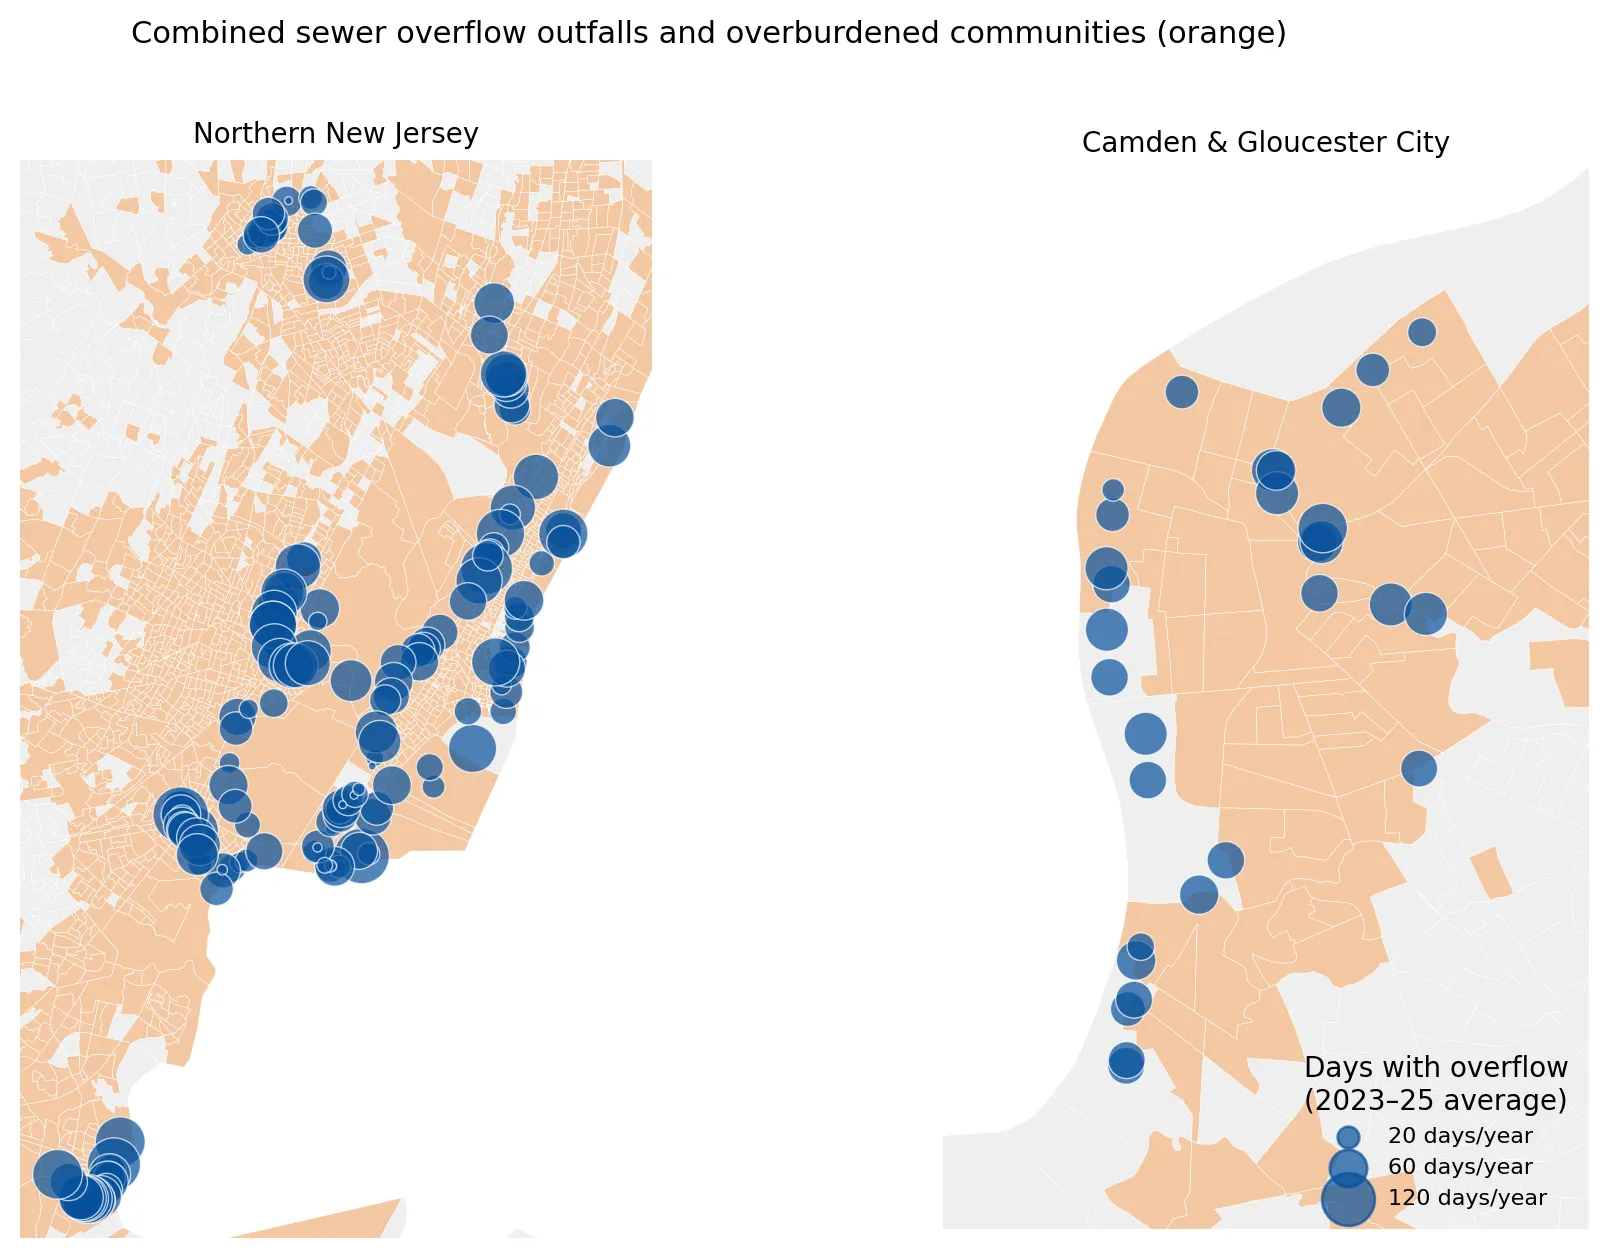
  1. Two maps showing combined sewer overflow outfalls as blue circles sized by average days with overflow per year, over orange overburdened communities, one for northern New Jersey and one for Camden and Gloucester City. Nearly all outfalls lie within overburdened communities, with large clusters along the Passaic and Hackensack waterways and Newark Bay.waterWhen It Rains, It Pours Sewage: Combined Sewer Overflows in New Jersey
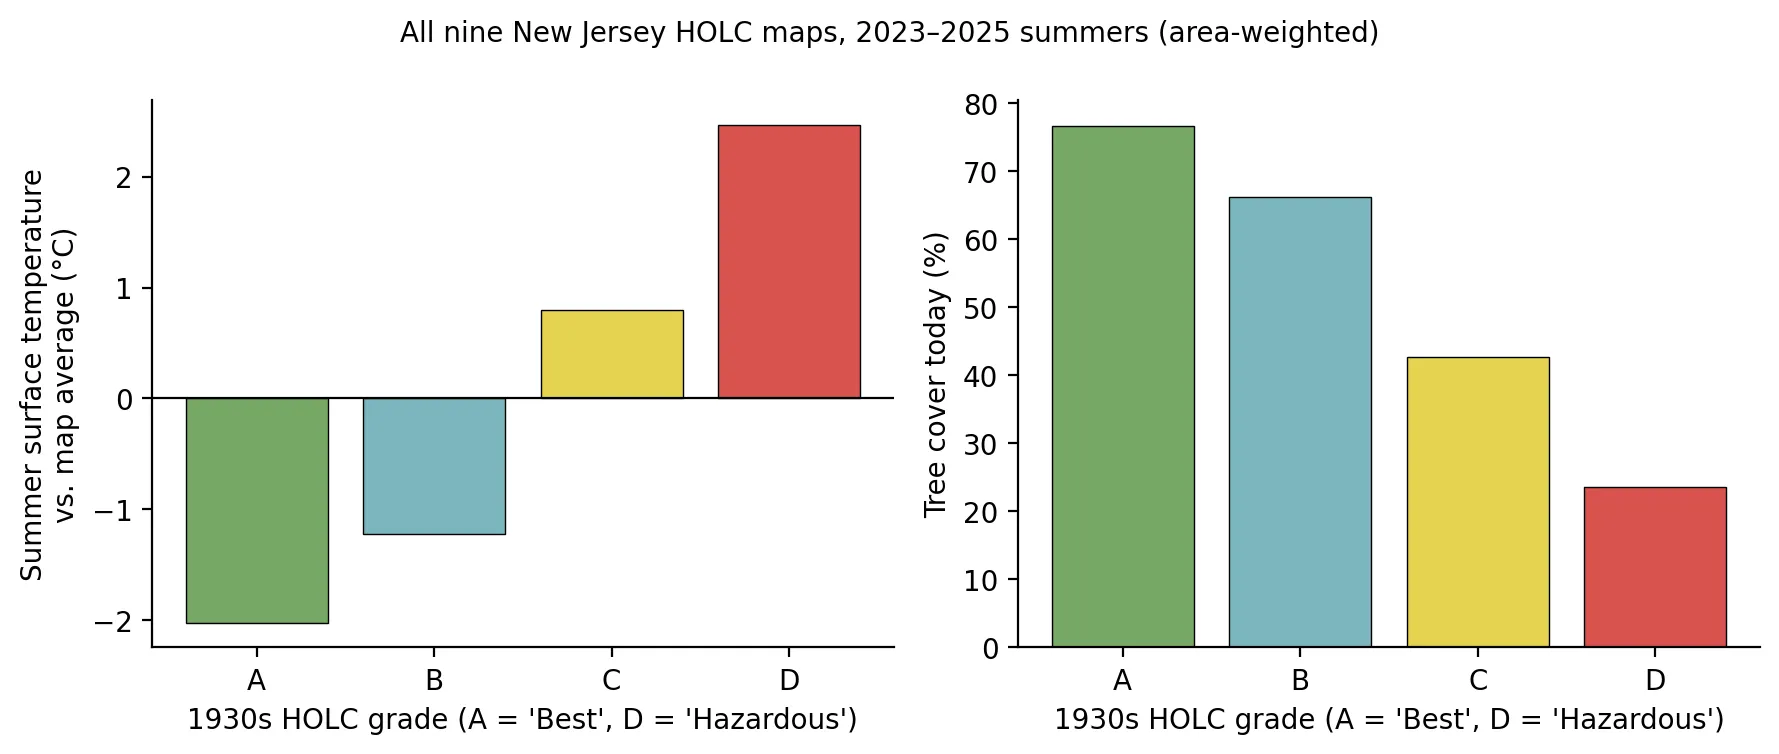
  2. Two bar charts by 1930s HOLC grade A to D. Summer surface temperature relative to the map average rises from about 2 degrees Celsius below average in grade A to about 2.5 above in grade D, while present-day tree cover falls from about 77% in A to about 24% in D.heatMapped in 1937, Hotter in 2026: Redlining, Trees, and Heat in New Jersey
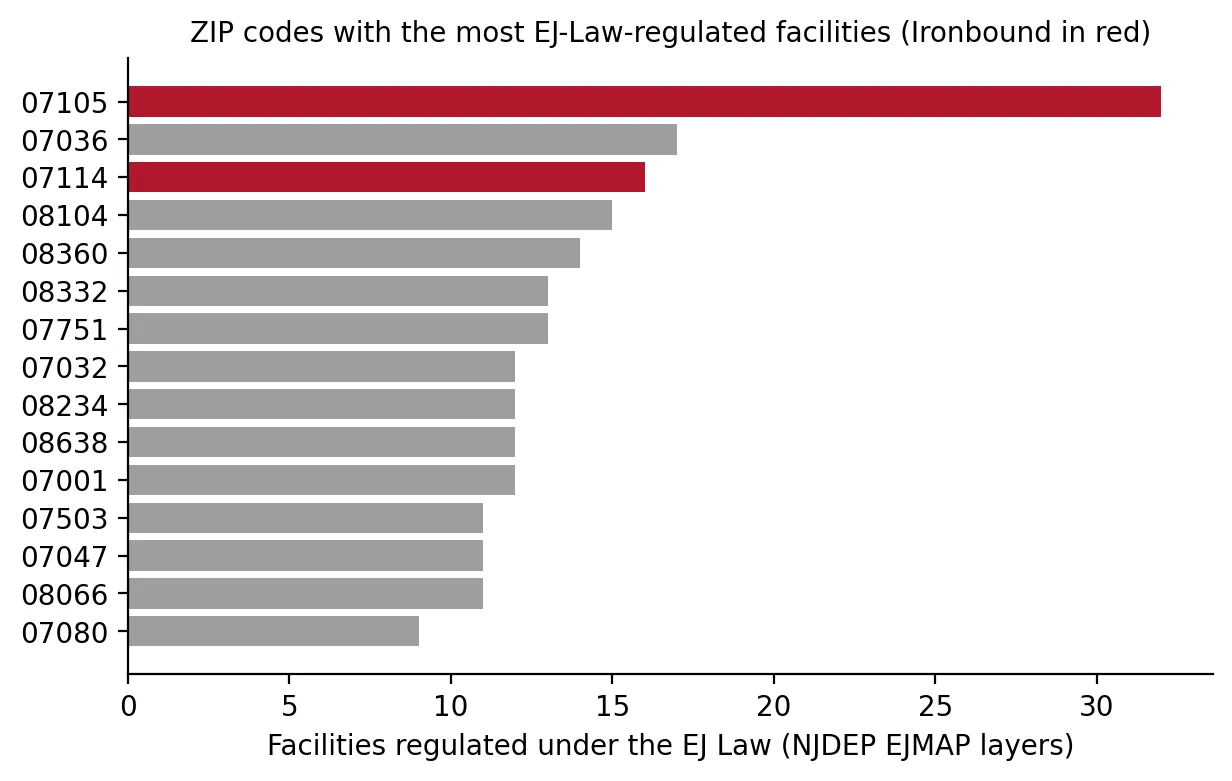
  3. Horizontal bar chart of the ZIP codes with the most EJ Law regulated facilities, with the two Ironbound ZIP codes in red. ZIP 07105 leads with 32, nearly twice the next ZIP (07036 with 17), and 07114 ranks third with 16.polluting facilitiesA Power Plant for Every Square Mile? The Ironbound and the Hardest Case for Environmental Justice Law