
Mapped in 1937, Hotter in 2026: Redlining, Trees, and Heat in New Jersey
Abstract. In the late 1930s, a federal agency graded neighborhoods in nine New Jersey map areas from “A – Best” to “D – Hazardous,” largely on the basis of who lived there. Nearly ninety years later, I measured summer surface temperatures and tree cover for all 667 of those graded neighborhoods using Landsat satellite imagery from 2023–2025. On the same map, neighborhoods graded D are, on average, 4.3 °C (7.8 °F) hotter at the surface than neighborhoods graded A (95% confidence interval: 2.4–5.9 °C). They have about 38 percentage points less tree cover, and 89% of their area now lies in state-designated overburdened communities. The gap appears on seven of eight maps and is largest in Bergen and Essex counties. A regression points to the mechanism: once present-day tree cover is accounted for, the HOLC grade no longer predicts temperature at all. The legacy of redlining shows up in heat largely through trees, and that suggests where policy can act.
1. A deadly summer, unevenly shared
From July 2 to 6, 2026, a heat wave brought temperatures as high as 108 °F to New Jersey. The state Department of Health reported 29 suspected heat-related deaths. Most of the people who died were found indoors without air conditioning, and at least nine were unhoused (NJ Spotlight News, 2026). Two weeks later, a second heat wave led Newark to declare a Code Red.
Heat is often called the deadliest weather hazard in the United States, but it does not fall evenly, even within one city. Pavement, rooftops, and dark surfaces absorb sunlight and release it as heat, while trees cool their surroundings through shade and evaporation. The result is the “urban heat island.” Researchers have repeatedly found that the hottest parts of American cities are disproportionately low-income neighborhoods and communities of color (Hoffman et al., 2020). New Jersey’s state utility board has named Newark, Trenton, Camden, and Jersey City among the most intense heat islands in the Northeast (NJ Board of Public Utilities [NJBPU], 2025).
Why are those particular neighborhoods so hot? One explanation goes back to a set of federal maps drawn before World War II.
2. Redlining: what the maps were, and what they did
The Home Owners’ Loan Corporation (HOLC), created in 1933 to refinance mortgages during the Great Depression, produced “residential security maps” for more than 200 American cities between 1935 and 1940. Local real estate appraisers graded each neighborhood from A (“Best,” green) to D (“Hazardous,” red). The written descriptions behind the grades routinely cited the presence of Black, immigrant, or working-class residents as reasons for a low grade (Nelson et al., n.d.; Rothstein, 2017). New Jersey has nine such maps: Atlantic City, Bergen County, Camden, Essex County (including Newark), Hudson County, Passaic County, Perth Amboy, Trenton, and Union County.
How much the HOLC maps caused later disinvestment is debated among economic historians. Aaronson et al. (2021) compared neighborhoods on either side of HOLC boundaries and found that lower grades led to lower homeownership, lower home values, and more racial segregation over the following decades. Fishback et al. (2022) argue that the HOLC maps themselves had little effect on lending, because the Federal Housing Administration had already developed its own, more consequential redlining methods. Both sides agree on the larger point: in the 1930s, federal housing policy systematically steered investment away from Black and immigrant neighborhoods. The HOLC maps are best understood as a record of that system, a snapshot of which neighborhoods institutions had decided to neglect.
For heat, the decades after the maps matter most. Neighborhoods starved of investment were more often zoned for industry, cut through by highways, and left with fewer parks and street trees, while favored neighborhoods kept their lawns and canopy. Nationally, Hoffman et al. (2020) found that formerly D-graded areas are on average 2.6 °C warmer at the surface than A-graded areas in the same city, with the pattern appearing in 94% of 108 cities studied. Locke et al. (2021) found that A-graded neighborhoods in 37 cities have about 43% tree canopy today, nearly twice the roughly 23% in D-graded neighborhoods.
Does New Jersey, the most densely populated state, follow the same pattern? I set out to measure it.
3. Methods in brief
Full code, data sources, and a step-by-step README are in code/.
- Neighborhoods. I used all 667 A–D graded polygons on New Jersey’s nine HOLC maps, digitized by the University of Richmond’s Mapping Inequality project (Nelson et al., n.d.).
- Heat. I used land surface temperature from Landsat 8 and 9 (USGS Collection 2, Level-2), accessed through Microsoft’s Planetary Computer: 33 clear summer scenes (June–August, 2023–2025) with less than 10% cloud cover. I removed pixels flagged as cloud, cloud shadow, or water. Because some days are hotter than others, I followed Hoffman et al. (2020) and expressed each neighborhood’s temperature as an anomaly: how much warmer or cooler it was than the average graded area on the same map on the same day. I then averaged those anomalies across days.
- Vegetation. I used two measures: NDVI (a satellite index of green vegetation, from the same Landsat scenes) and the percentage of each neighborhood classified as tree cover in the European Space Agency’s 10-meter WorldCover 2021 map.
- Present-day burden. I measured the share of each neighborhood’s area that falls in an overburdened community under New Jersey’s Environmental Justice Law, using the NJDEP data from my previous post.
- Statistics. I compared grades within each map, then averaged across maps. I estimated uncertainty with a “cluster bootstrap” that resamples whole maps, so that a single unusual city cannot drive the result. I also ran a regression with map fixed effects (which compares neighborhoods only to others on the same map) to test whether tree cover explains the grade differences.
4. Results
The grades still sort the heat
Across all nine maps, temperature rises steadily from A to D (Figure 1). A-graded neighborhoods average 2.0 °C cooler than their map’s average graded area, and D-graded neighborhoods average 2.5 °C hotter. Tree cover falls in the opposite direction, from 77% in A areas to 24% in D areas.
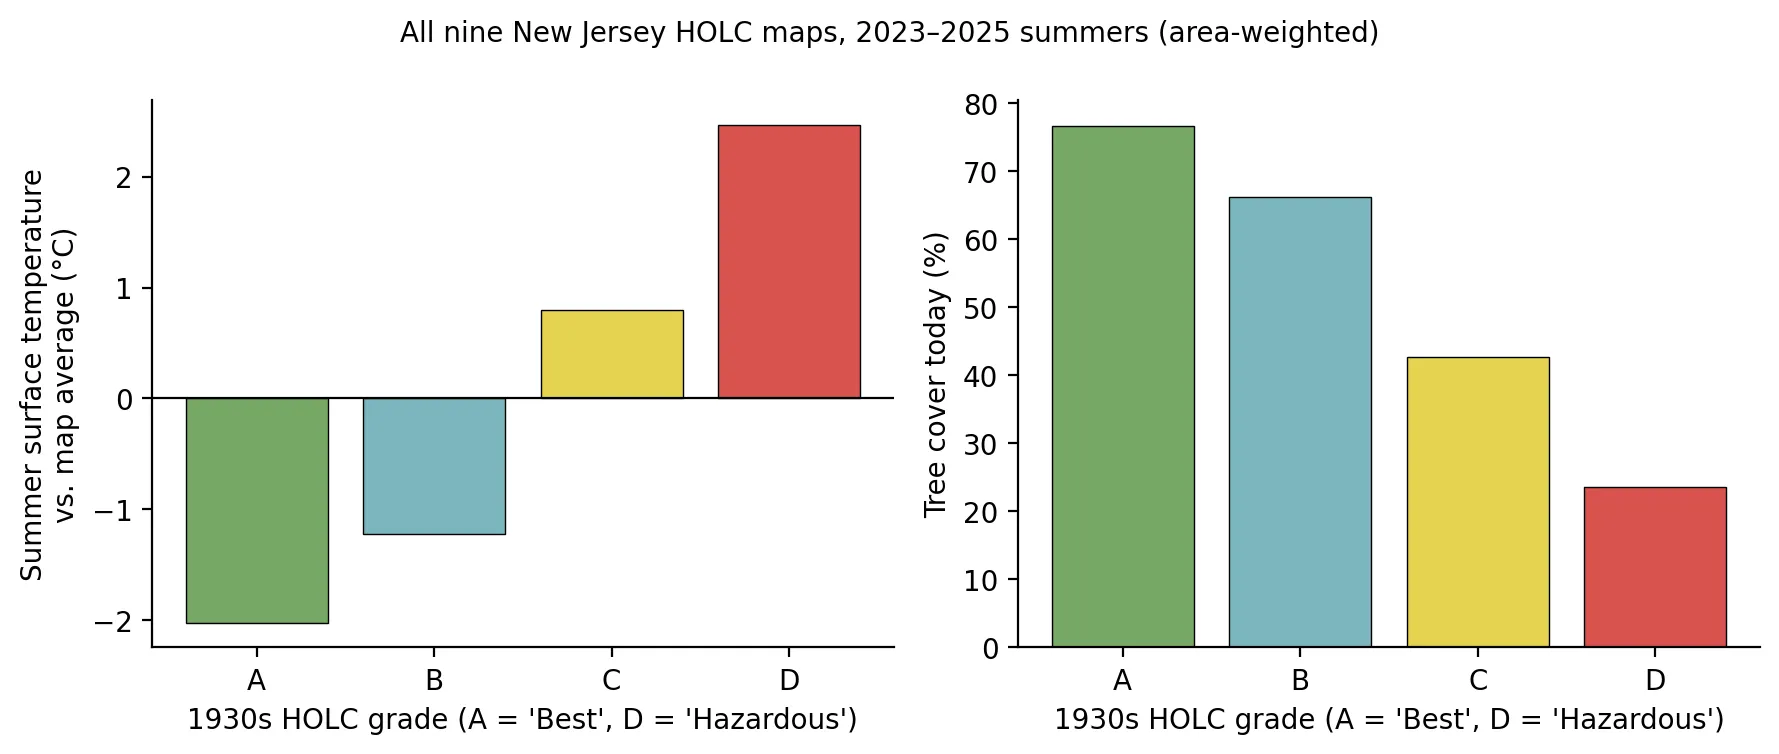 Figure 1. Summer surface temperature (relative to each map’s average) and present-day tree cover, by 1930s HOLC grade. Area-weighted, all nine New Jersey maps.
| HOLC grade | Neighborhoods | Surface temp. vs. map average | Tree cover | Area in a present-day overburdened community |
|---|---|---|---|---|
| A (“Best”) | 69 | −2.0 °C | 77% | 42% |
| B (“Still Desirable”) | 194 | −1.2 °C | 66% | 47% |
| C (“Definitely Declining”) | 277 | +0.8 °C | 43% | 71% |
| D (“Hazardous”) | 127 | +2.5 °C | 24% | 89% |
Comparing D with A within each map and then averaging across maps, D-graded neighborhoods are 4.3 °C hotter (95% CI: 2.4 to 5.9 °C) and have 38 percentage points less tree cover (95% CI: 20 to 52 points). That temperature gap is larger than the 2.6 °C national average reported by Hoffman et al. (2020). Their study and mine use somewhat different scenes and methods, so the comparison should be read cautiously, but it suggests that New Jersey’s redlining heat gap is at least as large as the national one.
Where the gap is largest
The gap appears on seven of the eight maps that have both A and D neighborhoods (Figure 4). It is largest in Bergen County (+7.4 °C) and Essex County (+7.2 °C), followed by Trenton (+5.6 °C), Camden (+4.4 °C), Union County (+4.3 °C), Perth Amboy (+3.8 °C), and Passaic County (+3.0 °C).
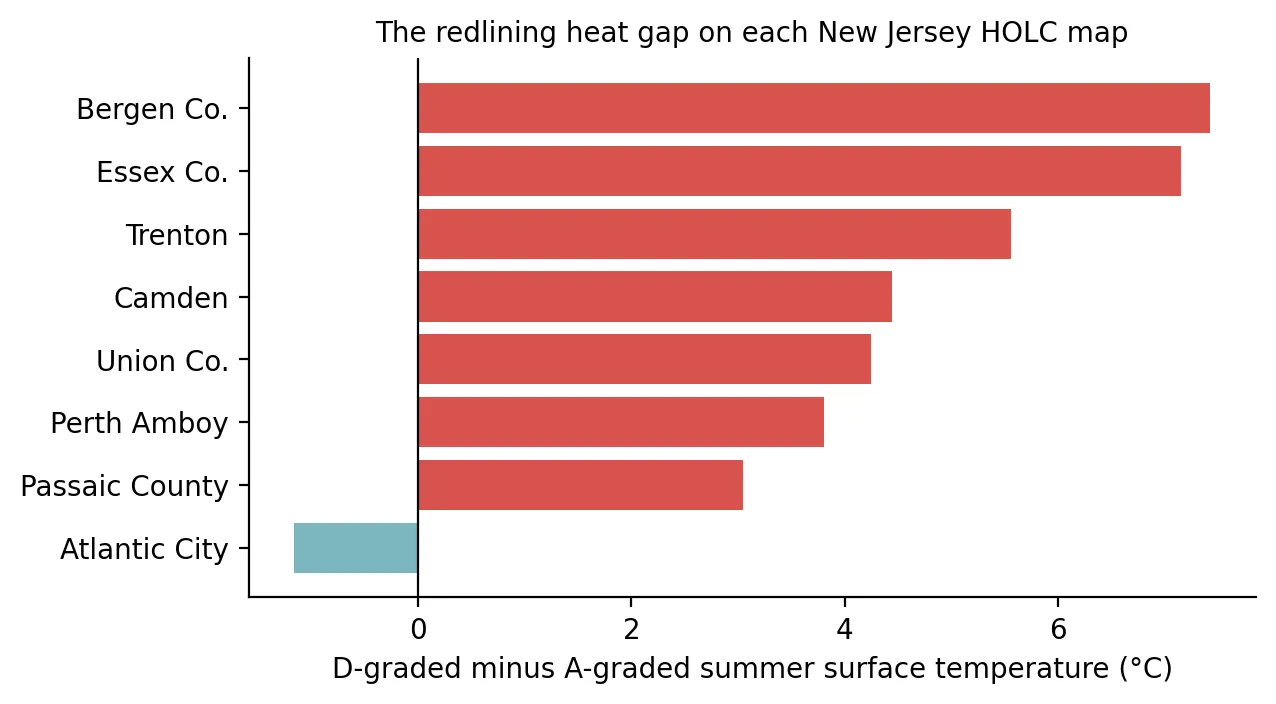 Figure 4. D-graded minus A-graded summer surface temperature on each map. Hudson County is not shown because its map has no A-graded neighborhoods.
Two maps behave differently, and the reasons are informative.
- Atlantic City is the only reversal (−1.2 °C). It has just two A-graded neighborhoods, both at the southern end of the barrier island, and they have almost no tree cover today (2%). That is less than Atlantic City’s D areas (21%). The exception supports the rule: the temperature follows the vegetation, not the grade itself.
- Hudson County received no A grades at all in the 1930s. Its B and D neighborhoods differ by only 0.4 °C today, because almost the entire county is now densely built.
Newark, Camden, and Trenton up close
Figure 2 places each city’s 1937 grades next to its 2023–2025 summer temperatures. The resemblance is clearest in Newark and Essex County. The cool A and B neighborhoods in the county’s western suburbs contrast sharply with the D-graded areas of Newark on the map’s eastern edge. Newark’s D neighborhoods average 5.3 °C above the map average, and two of them are about 8 °C above it, with only 1–3% tree cover. In Essex County, A areas have 82% tree cover and D areas have 23%.
In Camden, D neighborhoods average 2.7 °C above the map average, with 18% tree cover compared with 72% in A areas. In Trenton, D neighborhoods average 2.3 °C above the map average, while the A-graded strip northwest of downtown, toward the Delaware River, is 3.2 °C below it. In all three cities, about 9 in 10 acres of formerly D-graded land now lie in overburdened communities (93% in Essex, 88% in Camden, 91% in Trenton).
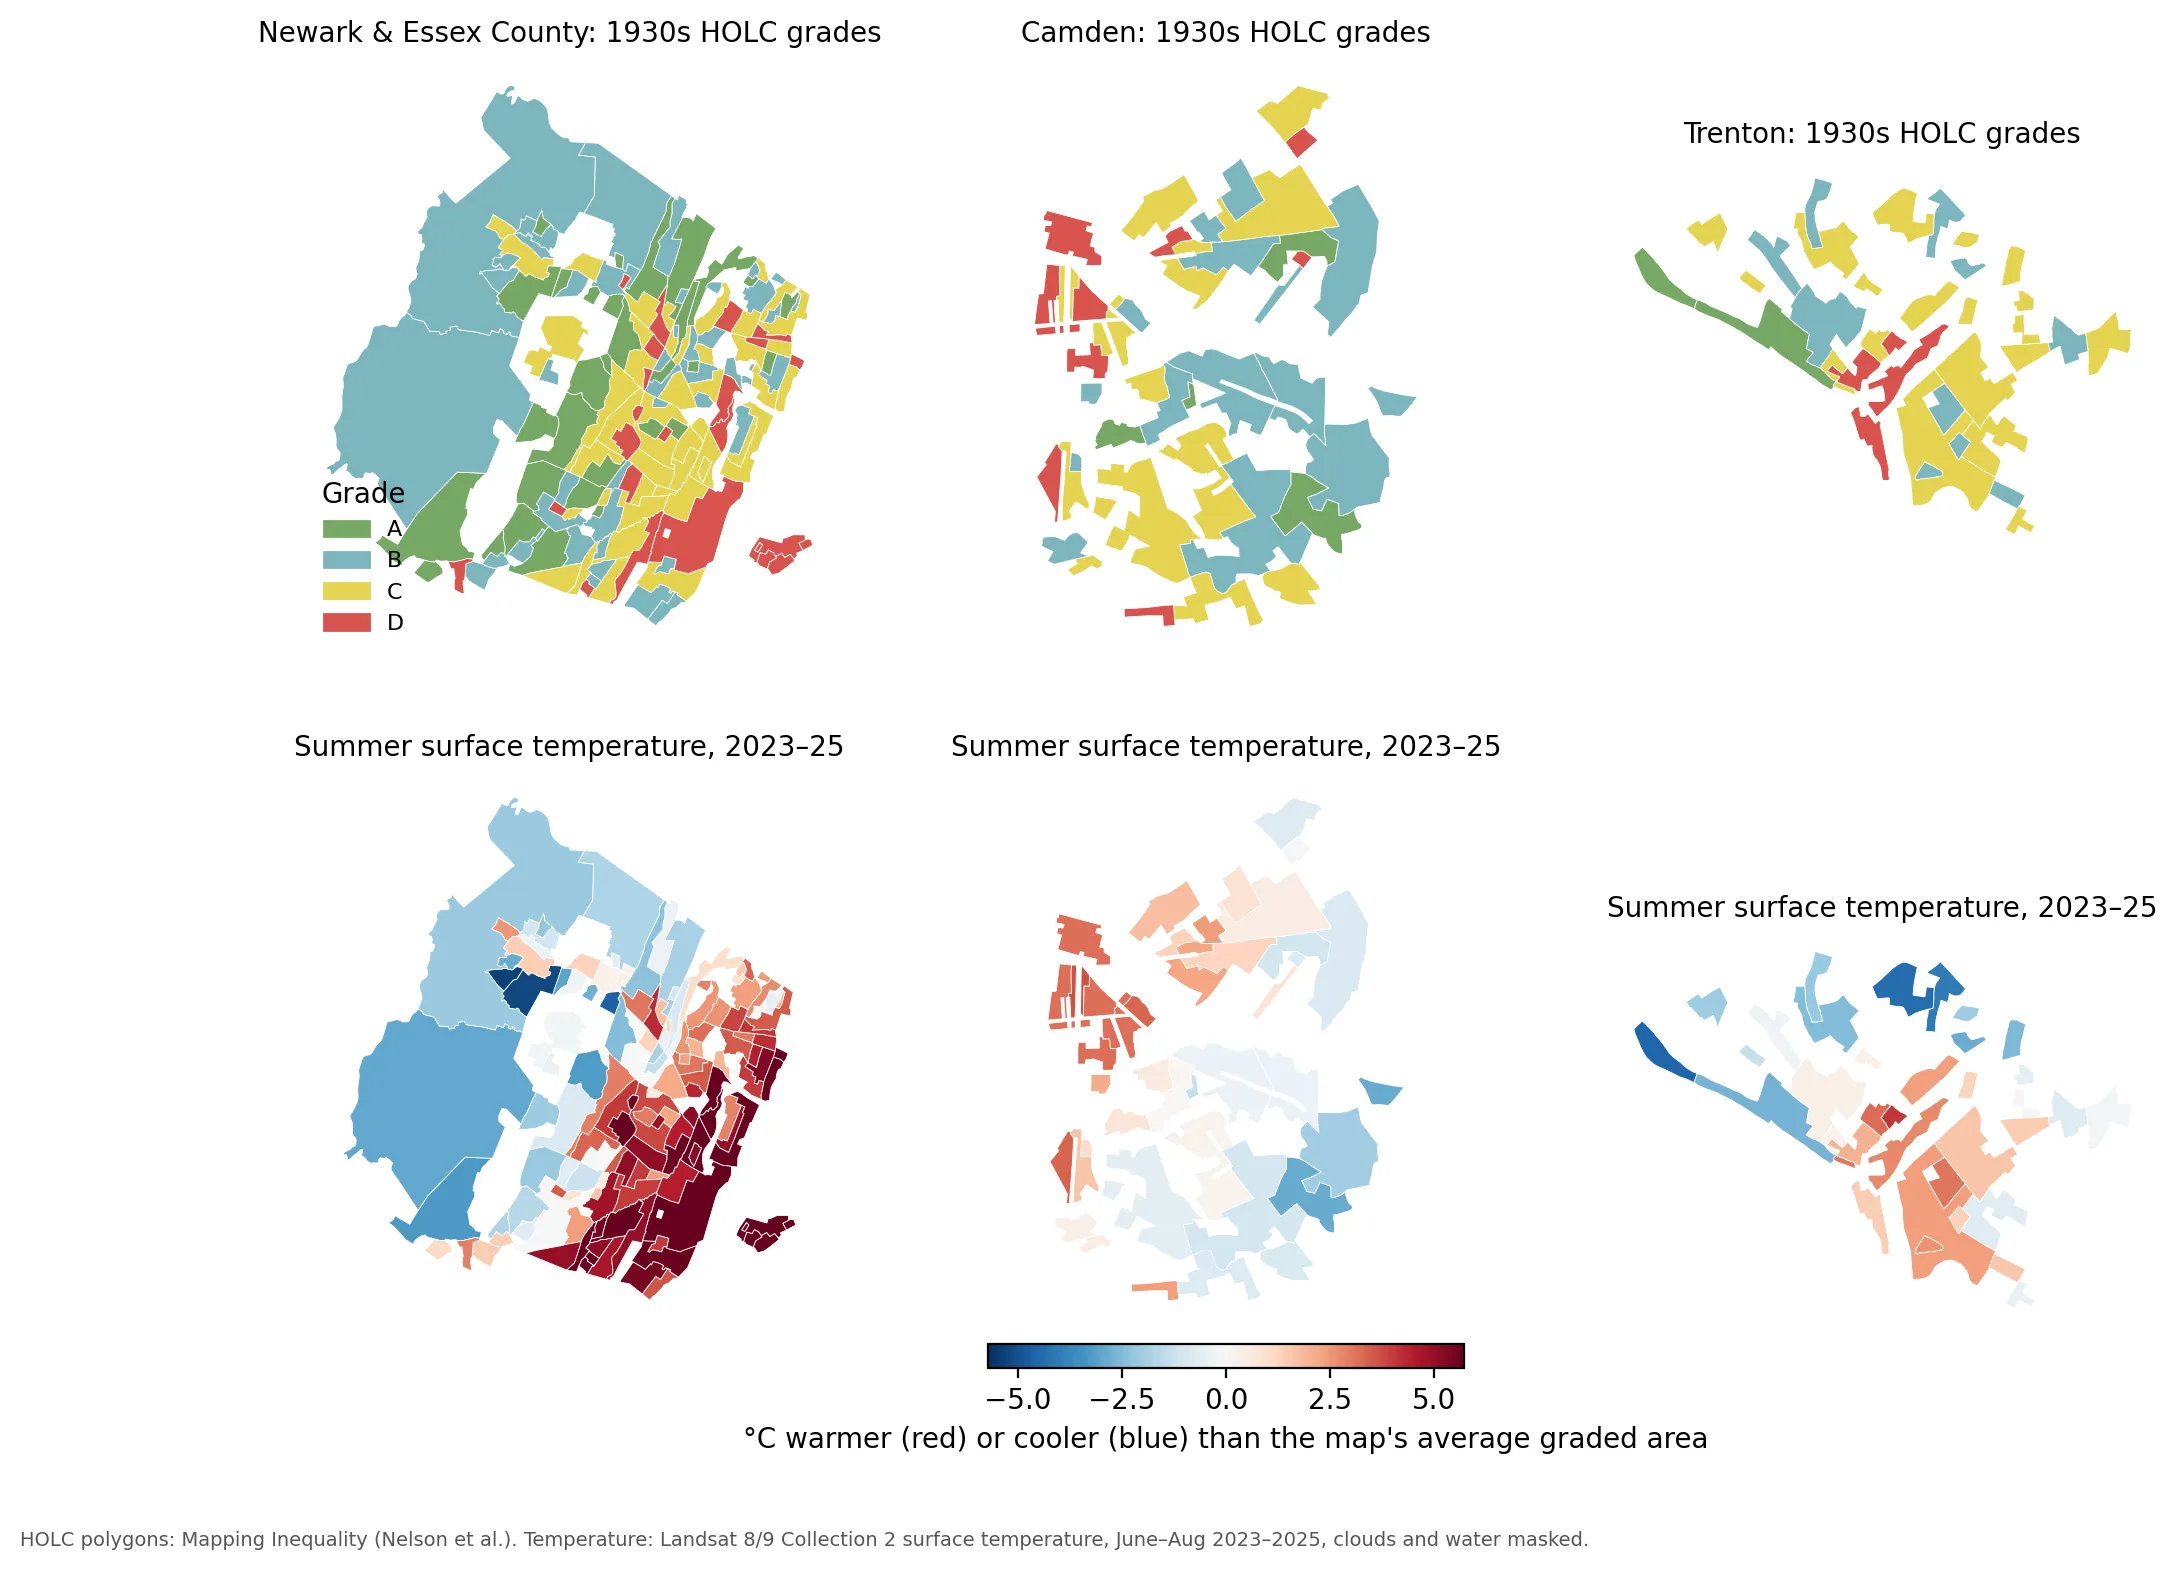 Figure 2. Top: 1930s HOLC grades. Bottom: summer surface temperature anomaly, 2023–2025.
Trees explain the gap
Why does a 90-year-old grade still predict temperature? To test whether present-day tree cover explains the pattern, I ran two regressions comparing neighborhoods within the same map.
| Model | D vs. A | C vs. A | Tree cover effect | R² |
|---|---|---|---|---|
| Grade only | +5.2 °C (SE 0.8) | +3.4 °C (SE 0.7) | — | 0.31 |
| Grade + present-day tree cover | −0.2 °C (SE 0.3) | −0.2 °C (SE 0.2) | −1.1 °C per 10 points of tree cover (SE 0.07) | 0.87 |
Once tree cover is in the model, the grade effects shrink to roughly zero, and the explained variation in temperature rises from 31% to 87%. In statistical terms, tree cover appears to mediate the relationship: redlined neighborhoods are hotter mainly because they have fewer trees (and, closely related, more pavement and rooftops). Each additional 10 percentage points of tree cover is associated with a neighborhood about 1.1 °C cooler at the surface (Figure 3).
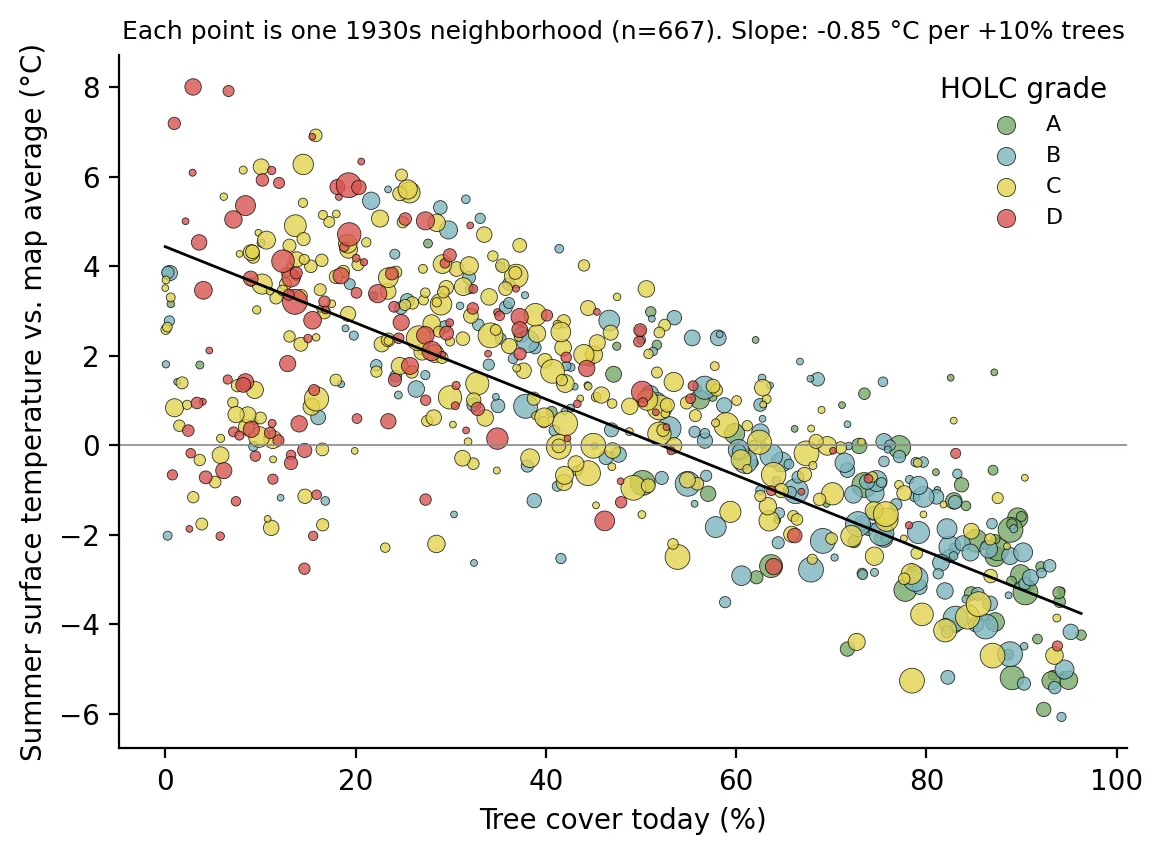 Figure 3. Each point is one 1930s neighborhood, sized by area and colored by HOLC grade. The line is a simple area-weighted fit.
This finding needs careful interpretation. It does not mean redlining “doesn’t matter” for heat. It suggests that redlining’s effect on heat runs largely through the built environment: decades of disinvestment produced neighborhoods with less canopy and more impervious surface. That is also encouraging, because unlike history, tree cover can be changed.
5. What New Jersey is doing
New Jersey has begun to respond. NJDEP released an Extreme Heat Resilience Action Plan in July 2024, and the state’s Interagency Council on Climate Resilience updated it in November 2025 (Lawrence, 2026). In March 2026, NJBPU awarded $5 million in Urban Heat Island Mitigation grants for 26 projects. They include $1 million for Trenton’s North and West Wards “Tree Arteries” project, $1 million for Camden’s Farnham Park redevelopment, $500,000 for a climate-resilient community space at Newark’s Firefighters Memorial Park, and smaller grants to groups such as the Center for Environmental Transformation in Camden and the Greater Newark Conservancy (NJBPU, 2026). Tree cover is also one of the 26 stressors in New Jersey’s Environmental Justice Law; lack of tree canopy is adverse in 88% of overburdened communities, and it shows the largest gap between overburdened and other communities of any stressor (see Post 1).
These efforts are small relative to the problem. My regression suggests that closing the average 38-point tree cover gap between A and D neighborhoods could be worth roughly 4 °C of surface cooling. But trees take decades to mature, and planting on dense urban blocks is expensive. Analysts have also warned that pauses in federal Inflation Reduction Act funding have disrupted New Jersey’s urban forestry grant cycles (Lawrence, 2026). Researchers and advocates have called for sustained, long-term funding rather than one-time grants, because a tree planted in 2026 does most of its cooling in the 2040s.
6. Limitations
- Surface temperature is not air temperature. Landsat measures how hot the ground and rooftops are, which is typically more extreme than the air temperature people breathe. Surface and air temperatures are related, but the 4.3 °C figure should not be read as a difference in the weather forecast.
- Satellite timing. Landsat passes over in the mid-morning (around 10–11 a.m. local time), before the afternoon peak and well before nighttime, when heat islands matter greatly for health. Some maps (Essex, Camden, Trenton, Union) had only seven fully clear scenes.
- Tree cover measurement. WorldCover classifies each 10-meter pixel as trees or not, so it is a coarser measure than the high-resolution canopy data used by Locke et al. (2021). My tree cover percentages are therefore not directly comparable to theirs. Tree cover is also strongly correlated with impervious surface, so the “tree effect” partly reflects everything that comes with fewer trees.
- Association, not proof of causation. The HOLC grades reflected neighborhood conditions that already existed in the 1930s, such as age of housing, density, and proximity to industry. This analysis shows that the grades still sort heat. It does not isolate how much of the gap the maps themselves caused, a question that is still debated (Aaronson et al., 2021; Fishback et al., 2022).
7. Conclusion
The neighborhoods that federal appraisers labeled “Hazardous” in the 1930s are, in a literal sense, the hazardous ones today: they are hotter, have fewer trees, and are now almost entirely overburdened communities. The physical pattern is clear, and so is the main lever. New Jersey’s heat gap is largely a tree gap. Closing it will require sustained investment in the same neighborhoods that were once deliberately denied it.
Data and methods
Data sources
- HOLC polygons (9 NJ maps, 667 graded areas) (Mapping Inequality, University of Richmond) Neighborhood boundaries and grades
- Landsat 8/9 Collection 2 Level-2 (USGS, via Microsoft Planetary Computer) Surface temperature (ST_B10) and NDVI (red, NIR08); 33 scenes from June–August 2023–2025, scene cloud cover < 10%
- ESA WorldCover 2021 v200 (10 m) (European Space Agency) % tree cover (class 10), excluding permanent water
- EJ Law Combined Stressor Summary (NJDEP (see Post 01)) % of area in a present-day overburdened community
The analysis was done in Python with public data. The full code, its data, and every figure it produces are in the code project below.
References
- Aaronson, D., Hartley, D., & Mazumder, B. (2021). The effects of the 1930s HOLC "redlining" maps. American Economic Journal: Economic Policy, 13(4), 355–392. https://doi.org/10.1257/pol.20190414
- European Space Agency. (2022). ESA WorldCover 10 m 2021 v200 [Data set]. https://doi.org/10.5281/zenodo.7254221
- Fishback, P., Rose, J., Snowden, K. A., & Storrs, T. (2022). New evidence on redlining by federal housing programs in the 1930s. Journal of Urban Economics, 103462. https://doi.org/10.1016/j.jue.2022.103462
- Hoffman, J. S., Shandas, V., & Pendleton, N. (2020). The effects of historical housing policies on resident exposure to intra-urban heat: A study of 108 US urban areas. Climate, 8(1), 12. https://doi.org/10.3390/cli8010012
- Lawrence, R. (2026, July 23). Tree equity and extreme heat in New Jersey. New Jersey State Policy Lab, Rutgers University. https://policylab.rutgers.edu/publication/tree-equity-and-extreme-heat-in-new-jersey/
- Locke, D. H., Hall, B., Grove, J. M., Pickett, S. T. A., Ogden, L. A., Aoki, C., Boone, C. G., & O'Neil-Dunne, J. P. M. (2021). Residential housing segregation and urban tree canopy in 37 US cities. npj Urban Sustainability, 1, 15. https://doi.org/10.1038/s42949-021-00022-0
- Nelson, R. K., Winling, L., et al. (n.d.). Mapping inequality: Redlining in New Deal America. In R. K. Nelson & E. L. Ayers (Eds.), American Panorama. University of Richmond Digital Scholarship Lab. https://dsl.richmond.edu/panorama/redlining/
- New Jersey Board of Public Utilities. (2025, July 17). NJ announces $5 million grant program to combat deadly urban heat [Press release]. https://www.nj.gov/bpu/newsroom/2025/approved/20250717.html
- New Jersey Board of Public Utilities. (2026, March 18). Urban Heat Island Mitigation Program awards [Press release and Board Order, Docket QO24100834]. https://www.nj.gov/bpu/newsroom/2026/approved/20260318.html
- NJ Spotlight News. (2026, July). Heat-related deaths spike in NJ during record temperatures. https://www.njspotlightnews.org/2026/07/heat-related-deaths-spike-in-nj-during-record-temperatures/
- Rothstein, R. (2017). The color of law: A forgotten history of how our government segregated America. Liveright.
- U.S. Geological Survey. (2023–2025). Landsat 8–9 Collection 2 Level-2 surface temperature and surface reflectance [Data set], accessed via Microsoft Planetary Computer. https://planetarycomputer.microsoft.com/dataset/landsat-c2-l2