
Old Homes, Old Paint: Who Lives Where Lead Paint Is Most Likely?
Lead is back in the news
On November 30, 2023, EPA proposed rules requiring water systems to replace lead pipes within 10 years (U.S. EPA, n.d.-a). Lead pipes get most of the headlines, but EPA says one of the most common sources of lead exposure in homes is dust and paint chips from lead-based paint (U.S. EPA, n.d.-b). The main concern is young children, who crawl, play on floors, and put their hands and toys in their mouths. Lead harms children’s developing brains, and the damage can’t be undone.
Lead paint was banned for homes in 1978, but it’s still on the walls, windows, and porches of older houses. The older the home, the more likely: EPA estimates that 87% of homes built before 1940 and 69% of homes built from 1940 to 1959 are likely to have lead-based paint (U.S. EPA, n.d.-b).
In the introduction, I argued that environmental burdens in New Jersey fall hardest on overburdened communities. This post looks at one burden that lives inside people’s homes: who lives in neighborhoods with the oldest housing, where lead paint is most likely?
Data
NJDEP’s EJ data include a “Potential Lead Exposure” measure for every neighborhood (census block group): the percent of homes built before 1950 (NJDEP, 2023). I used the version in effect in January 2024 and compared 6,523 populated neighborhoods.
Findings
Overburdened communities have older housing
On average, 33% of homes in overburdened communities were built before 1950, compared with 22% in other neighborhoods.
More than a million people in overburdened communities live where most homes are pre-1950
| Overburdened community residents | Other residents | |
|---|---|---|
| Live where most homes (50%+) were built before 1950 | 1,183,049 (24%) | 464,730 (11%) |
| Live where three-quarters or more were built before 1950 | 244,201 (5%) | 115,429 (3%) |
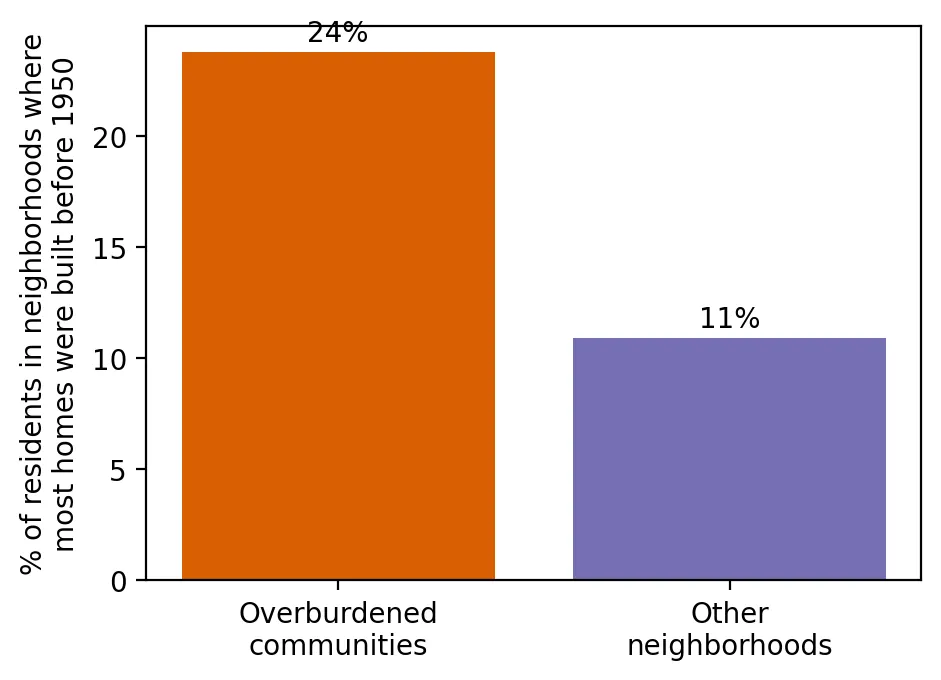 Figure 2. Residents of overburdened communities are more than twice as likely to live where most homes were built before 1950.
Residents of overburdened communities are more than twice as likely to live in a neighborhood where most homes predate 1950. Of everyone in New Jersey living in such neighborhoods, 72% live in overburdened communities.
The more diverse the neighborhood, the older the housing
| Neighborhoods grouped by % people of color | Avg. % people of color | Avg. % homes built before 1950 |
|---|---|---|
| Fewest | 8% | 21% |
| 2nd | 22% | 22% |
| Middle | 40% | 26% |
| 4th | 65% | 32% |
| Most | 92% | 40% |
 Figure 1. The more people of color in a neighborhood, the larger the share of homes built before 1950.
In the neighborhoods with the most people of color, 40% of homes were built before 1950, almost twice the share in the least diverse neighborhoods.
County by county
In 16 of New Jersey’s 21 counties, overburdened neighborhoods have older housing on average than other neighborhoods in the same county. The gaps are largest in Warren (57% vs. 26%), Passaic (49% vs. 25%), and Mercer (38% vs. 18%).
Why this matters
Old housing isn’t a problem by itself; lead paint that peels, chips, or turns to dust is. Renters often can’t control repairs, and families with less money have a harder time paying to remove lead safely. When the oldest housing is concentrated in overburdened communities, the risk of childhood lead poisoning is concentrated there too, on top of the risk from lead pipes.
Limitations
- Old housing is a proxy. Not every old home has lead paint, and many have been safely renovated.
- 1950 is a cutoff. Homes built from 1950 to 1977 can also contain lead paint.
- The measure comes from Census survey estimates, which have margins of error for small areas.
Code project (Level 0): comparing groups
Goal: Compare how much old housing (built before 1950) overburdened communities and other neighborhoods have.
Data: NJDEP EJ Law data (version effective July 31, 2023 – January 30, 2024), “Potential Lead Exposure” (percent of housing built before 1950).
Steps:
- Load the data and keep neighborhoods with residents.
- Compare the average % of old housing in overburdened and other neighborhoods.
- Add up how many people live where at least half of homes predate 1950.
- Split neighborhoods into five equal groups by % people of color and compare.
- Compare overburdened and other neighborhoods within each county, and make bar charts.
bg["pre1950"] = bg["AGEOFHOUSING_BG"]
print(bg.groupby("is_obc").pre1950.mean())
old = bg[bg.pre1950 >= 50]
print(old.TOTALPOP[old.is_obc].sum() / old.TOTALPOP.sum())      # share living in OBCs
New skills: comparing group averages, counting people above a threshold, and splitting data into fifths.
Data and methods
Data sources
- NJDEP EJ Law data (version effective July 31, 2023 – January 30, 2024), "Potential Lead Exposure" (percent of housing built before 1950).
The analysis was done in Python with public data. The full code, its data, and every figure it produces are in the code project below.
References
- New Jersey Department of Environmental Protection. (2023). Environmental Justice (EJ) Law Combined Stressor Summary for New Jersey (7-31-2023 to 1-30-2024) [Data set]. https://www.arcgis.com/home/item.html?id=cbfeefc67d2a4f71bdcc1eda9a629fa4
- U.S. Environmental Protection Agency. (n.d.-a). Proposed Lead and Copper Rule Improvements. https://www.epa.gov/ground-water-and-drinking-water/proposed-lead-and-copper-rule-improvements
- U.S. Environmental Protection Agency. (n.d.-b). Protect your family from sources of lead. https://www.epa.gov/lead/protect-your-family-sources-lead