Room to Breathe: Who Has Parks and Open Space Nearby?
A hot start to summer
Summer 2024 started with a heat wave. Newark Airport reached at least 91°F every day from June 17 to 23, hitting 100°F on June 21 (NOAA, n.d.). On days like that, a nearby park can make a real difference: trees and grass are cooler than pavement and rooftops (U.S. EPA, n.d.), and parks give people somewhere to cool off, exercise, and let kids play. Parks also absorb stormwater and filter some air pollution.
But not every neighborhood has a park within walking distance, and in some, a small park has to serve thousands of people. New Jersey’s environmental justice rules count lack of recreational open space as one of the stressors that add to a community’s burden. This post asks: who has room to breathe?
Data
NJDEP’s EJ data include a “Lack of Recreational Open Space” measure for every neighborhood (census block group): the number of residents per acre of recreational open space within a quarter mile, roughly a five-minute walk (NJDEP, 2024). A higher number means a neighborhood has less park space for its people, either because parks are tiny and crowded or because there are almost none. I used the version in effect in July 2024 and compared 6,526 populated neighborhoods.
A quick statistics note: This measure is very skewed. A few neighborhoods with almost no parks have huge values, which pull the average up. So I mainly use the median, the middle value when all neighborhoods are lined up, which better represents a “typical” neighborhood.
Findings
Overburdened communities share each acre of park with more than three times as many people
| Overburdened communities | Other neighborhoods | |
|---|---|---|
| Median residents per acre of nearby open space | 69 | 19 |
| Residents living in the most park-poor fifth of NJ neighborhoods | 33% | 8% |
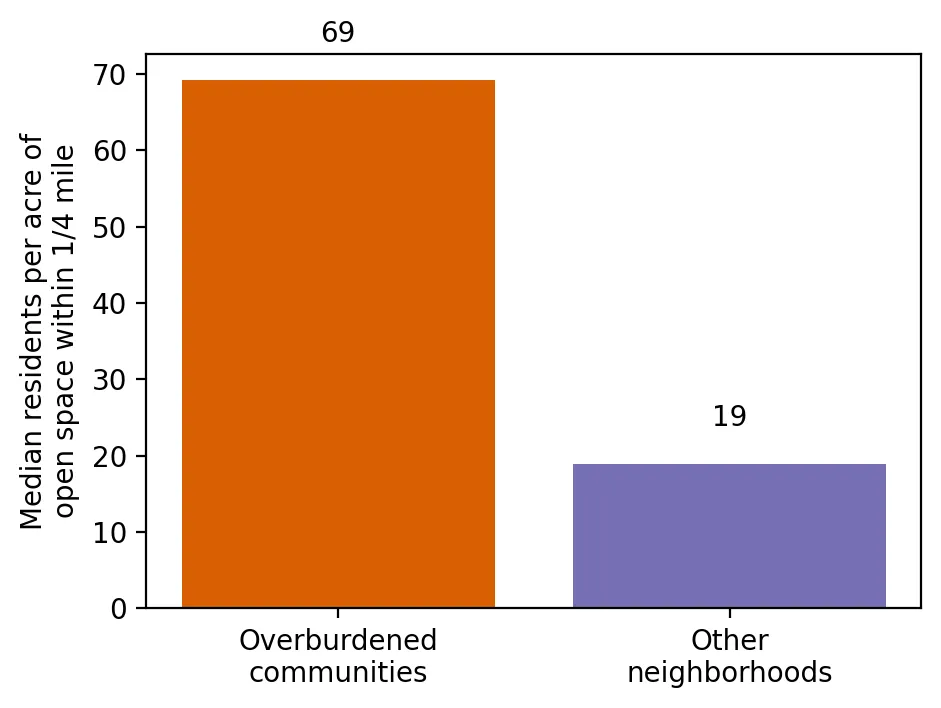 Figure 2. A typical overburdened community shares each acre of nearby park space with more than three times as many people.
In a typical overburdened community, every acre of nearby park space is shared by about 69 people. In a typical other neighborhood, it’s about 19. One in three residents of overburdened communities lives in New Jersey’s most park-poor fifth of neighborhoods, compared with one in twelve other residents.
The most park-poor fifth of neighborhoods are home to about 2 million people, and 82% of those neighborhoods are overburdened communities.
The more diverse the neighborhood, the fewer the parks
| Neighborhoods grouped by % people of color | Avg. % people of color | Median residents per acre of open space | % in the most park-poor fifth of NJ |
|---|---|---|---|
| Fewest | 8% | 16 | 8% |
| 2nd | 23% | 19 | 9% |
| Middle | 41% | 31 | 13% |
| 4th | 66% | 61 | 25% |
| Most | 92% | 137 | 45% |
 Figure 1. Neighborhoods with more people of color are far more likely to be among the state’s most park-poor.
In the neighborhoods with the most people of color, each acre of nearby park space is shared by a median of 137 people, more than eight times as many as in the least diverse neighborhoods. Nearly half of these neighborhoods (45%) are among the most park-poor in the state.
In every county
In all 21 of New Jersey’s counties, the typical overburdened neighborhood has more people per acre of nearby open space than the typical other neighborhood in the same county.
Why this matters
Parks are a health resource: places to stay cool, get exercise, breathe cleaner air, and recover from stress. In New Jersey, those resources are thinnest in the communities that also face more pollution. During heat waves like June 2024’s, that gap can be dangerous.
Limitations
- Quarter-mile walk only. Larger parks a bit farther away aren’t counted.
- Acres aren’t quality. The measure doesn’t capture whether a park has shade, safe equipment, or pools.
- Population density matters. Dense cities naturally have more people per acre, but that’s part of the point: dense neighborhoods need more park space, not less.
Code project (Level 0): median vs. average
Goal: Compare access to parks and open space in overburdened and other neighborhoods.
Data: NJDEP EJ Law data (version effective January 31 – July 30, 2024), “Lack of Recreational Open Space” (residents per acre of open space within ¼ mile).
Steps:
- Load the data and keep neighborhoods with residents.
- Compare the median and the average. See how a few extreme values change the average.
- Find the most park-poor 20% of neighborhoods and how many are overburdened communities.
- Split neighborhoods into five groups by % people of color and compare.
- Compare within each county and make bar charts.
print(bg.groupby("is_obc")["LACKOFOPENSPACE_BG"].median())      # typical neighborhood
print(bg.groupby("is_obc")["LACKOFOPENSPACE_BG"].mean())        # pulled up by extreme values
worst = bg["LACKOFOPENSPACE_BG"] >= bg["LACKOFOPENSPACE_BG"].quantile(0.8)
print(bg.is_obc[worst].mean())                                  # share of the most park-poor that are OBCs
New skills: medians vs. averages with skewed data, percentiles, and comparing within groups.
Data and methods
Data sources
- NJDEP EJ Law data (version effective January 31 – July 30, 2024), "Lack of Recreational Open Space" (residents per acre of open space within ¼ mile).
The analysis was done in Python with public data. The full code, its data, and every figure it produces are in the code project below.
References
- New Jersey Department of Environmental Protection. (2024). Environmental Justice (EJ) Law Combined Stressor Summary 20240131 to 20240730 [Data set]. https://www.arcgis.com/home/item.html?id=ec82e4d006c64553b7712abcbe36e34b
- NOAA National Centers for Environmental Information. (n.d.). GHCN-Daily station detail: Newark Liberty International Airport (USW00014734) [Data set]. https://www.ncei.noaa.gov/cdo-web/datasets/GHCND/stations/GHCND:USW00014734/detail
- U.S. Environmental Protection Agency. (n.d.). Learn about heat islands. https://www.epa.gov/heatislands/learn-about-heat-islands