Lead in Children's Blood: What the State's Newest Report Showed, and Why It Was Already Three Years Old
Why lead still matters
There is no safe level of lead in a child’s blood. Even low levels are linked to lower IQ, attention problems, and lower school achievement, and the damage is largely permanent. In New Jersey, the main sources are lead-based paint in homes built before 1978 (which turns into dust and chips as it ages), contaminated soil, and drinking water that passes through lead service lines. In 2021, after the Newark water crisis, New Jersey passed a law requiring every water utility to replace all lead service lines within ten years (New Jersey Legislature, 2021).
New Jersey requires doctors to test young children for lead, and the Department of Health (NJDOH) publishes an annual report with results for every large municipality (over 35,000 residents).
A three-year information gap
As of September 26, 2025, NJDOH’s reports page listed the State Fiscal Year (SFY) 2022 report as the newest (Internet Archive, 2025). SFY 2022 covers July 2021 to June 2022. Anyone trying to understand childhood lead exposure in October 2025, including parents, city officials, and researchers, was working with data more than three years old. This lag is common in public health reporting, but it means progress or setbacks in a city could go unnoticed for years.
This post uses the SFY 2022 report and compares it with SFY 2019, just before the pandemic disrupted testing.
Findings
Where children are most affected (SFY 2022)
Statewide, 1.9% of children under six who were tested had an elevated blood lead level (5 µg/dL or higher), down from 2.3% in SFY 2019 (NJDOH, n.d.-a, n.d.-b). The burden is concentrated in older cities:
| Municipality | Children with elevated blood lead | Children tested | % elevated |
|---|---|---|---|
| Newark | 359 | 11,362 | 3.2% |
| Paterson | 195 | 5,559 | 3.5% |
| Trenton | 171 | 2,797 | 6.1% |
| Jersey City | 137 | 5,691 | 2.4% |
| Irvington | 132 | 2,441 | 5.4% |
| Elizabeth | 126 | 4,429 | 2.8% |
| Plainfield | 100 | 2,714 | 3.7% |
| East Orange | 97 | 2,045 | 4.7% |
Trenton’s rate (6.1%) was more than three times the state average, and unlike most cities, it did not improve between 2019 (5.9%) and 2022. Camden also edged up (3.1% to 3.3%). Newark (3.9% to 3.2%), East Orange (6.6% to 4.7%), and Atlantic City (5.9% to 3.2%) improved.
Old housing and overburdened communities both predict it
Across the 67 large municipalities, the share of children with elevated blood lead rises strongly with the share of housing built before 1950 (Spearman’s ρ = 0.75) and with the share of residents living in overburdened communities (ρ = 0.74).
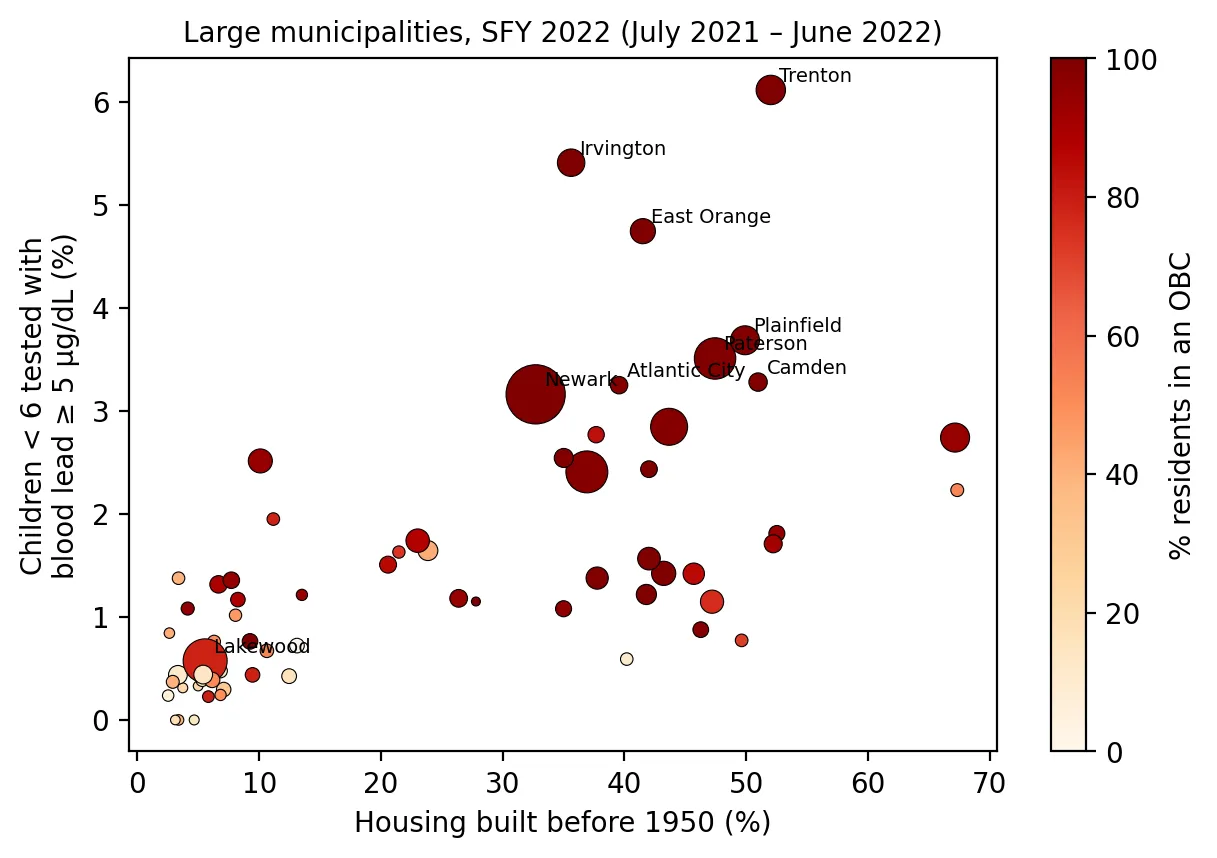 Figure 1. Municipalities with more pre-1950 housing and more residents in overburdened communities have higher shares of children with elevated blood lead.
These two factors overlap, since older cities have both old housing and large overburdened populations. To see whether each matters on its own, I fit a weighted multiple regression, giving towns with more tested children more weight:
| Predictor | Effect on % of children elevated | p-value |
|---|---|---|
| +10 percentage points of pre-1950 housing | +0.34 points | 0.001 |
| +10 percentage points of residents in OBCs | +0.20 points | < 0.001 |
R² = 0.48; n = 67 municipalities.
Both remain significant. Old housing has a clear physical explanation: lead paint. The fact that OBC share still matters after accounting for housing age suggests other factors associated with poverty and segregation, such as poorly maintained rental housing, delayed repairs, crowding, and less access to testing and abatement, add to children’s risk beyond the age of the building.
What this means
New Jersey’s attention after 2019 focused heavily on lead pipes, and the 2021 law will remove them by 2031. But the data point to housing as at least as important. Trenton is a warning sign. Its rate did not improve, and it is the city most in need of both pipe replacement and lead-safe housing. With a three-year reporting lag, the state may not know for years whether newer efforts are working.
Limitations
- Testing is incomplete and uneven. Only about a quarter of New Jersey children under six were tested in SFY 2022, and testing rates vary by town, which NJDOH warns makes comparisons between municipalities imperfect.
- Pandemic effects. SFY 2022 overlaps the COVID-19 pandemic, when fewer children visited doctors.
- Ecological analysis. These are town-level patterns, not information about individual children.
Code project (Level 3): from PDF to regression
Goal: Extract municipal blood lead tables from two NJDOH PDFs and explain differences across towns.
Data: NJDOH Childhood Lead Exposure in New Jersey annual reports, SFY 2019 and SFY 2022; NJDEP municipal boundaries; NJDEP EJ data (version in effect on the cutoff date) for pre-1950 housing and OBC status.
Method:
- Check what was public. An Internet Archive snapshot of NJDOH’s reports page (September 2025) confirmed SFY 2022 was the newest report available.
- Extract text with
pypdf. Find the “children younger than six by large municipality” table, taking the last match so the table of contents isn’t picked up. Then parse each row with a regular expression. - Assign block groups to municipalities with a spatial join (NJDEP’s dataset fills in town names only for OBCs) and compute population-weighted averages.
- Match town names between sources, then fit a weighted least squares regression with robust standard errors.
m = smf.wls("pct_ebll ~ pre1950 + obc_share", data=towns, weights=towns.n_screened).fit(cov_type="HC1")New skills: extracting structured data from PDFs, checking data availability with web archives, and weighted regression.
Data and methods
Data sources
- NJDOH *Childhood Lead Exposure in New Jersey* annual reports, SFY 2019 and SFY 2022; NJDEP municipal boundaries; NJDEP EJ data (version in effect on the cutoff date) for pre-1950 housing and OBC status.
The analysis was done in Python with public data. The full code, its data, and every figure it produces are in the code project below.
References
- Internet Archive. (2025, September 26). Snapshot of NJDOH Childhood Lead Program: Reports and data. https://web.archive.org/web/20250926092902/https://www.nj.gov/health/childhood-lead/reports-data/
- New Jersey Department of Health. (n.d.-a). Childhood lead exposure in New Jersey: Annual report, SFY 2019. https://www.nj.gov/health/childhood-lead/documents/childhood-lead-2019-annual-report.pdf
- New Jersey Department of Health. (n.d.-b). Childhood lead exposure in New Jersey: Annual report, SFY 2022. https://www.nj.gov/health/childhood-lead/documents/childhood-lead-2022-annual-report.pdf
- New Jersey Department of Health. (n.d.-c). Childhood lead: Reports and data. https://www.nj.gov/health/childhood-lead/reports-data/
- New Jersey Legislature. (2021). P.L.2021, c.183 [Lead service line replacement]. https://pub.njleg.gov/bills/2020/PL21/183_.PDF