
Sewage in the Rain: After Accounting for Weather, Are New Jersey's Sewer Overflows Declining?
Background
In New Jersey’s oldest cities, including Newark, Jersey City, Paterson, Elizabeth, Bayonne, Camden, and others, one set of pipes carries both sewage and stormwater. When heavy rain overwhelms these combined sewer systems, they overflow at permitted outfalls into rivers and bays, releasing untreated sewage mixed with runoff (U.S. EPA, n.d.). New Jersey has about 200 such outfalls operated by 21 permit holders (NJDEP, n.d.).
In 2015, NJDEP required every combined sewer system to prepare a Long-Term Control Plan by 2020 (Rutgers CUPR, 2015). Those plans, now being carried out, include storage tunnels, treatment upgrades, sewer separation, and green infrastructure, at a cost of billions of dollars. By early 2026, a fair question was whether overflows were starting to decline.
Answering it is harder than it looks, because overflows depend on rain. A dry year will show fewer overflows even if nothing has been fixed.
Data
Every permit holder files monthly reports to the federal ECHO database, listing the number of days each outfall discharged and the month’s rainfall (U.S. EPA, 2026). I used all reports for January 2023 through December 2025: 7,449 outfall-months from 207 outfalls. (December 2025 reports were due by late January 2026, before this post’s cutoff.)
Findings
Raw numbers suggest improvement, but rainfall fell too
| Year | Mean overflow days per outfall-month | Mean monthly rainfall reported |
|---|---|---|
| 2023 | 5.17 | 4.34 in |
| 2024 | 4.31 | 3.56 in |
| 2025 | 4.01 | 2.89 in |
Overflow days fell 22% from 2023 to 2025, but rainfall fell even more, by 33%. That makes it impossible to tell from the raw numbers alone whether the systems improved.
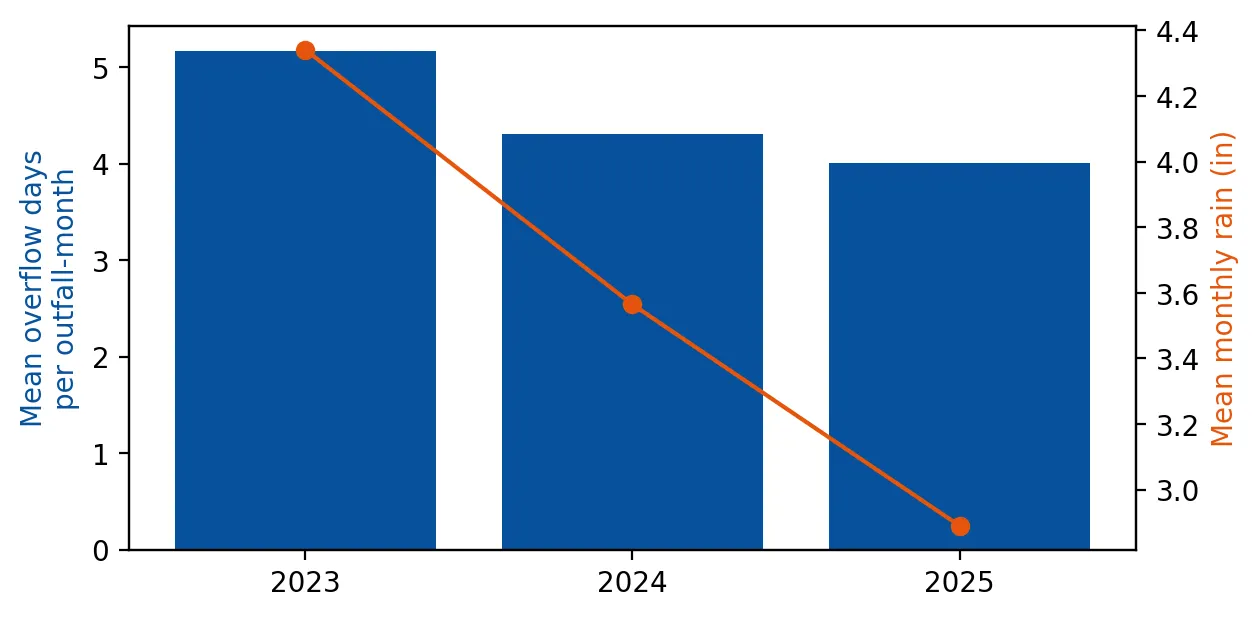 Figure 2. Raw overflow days fell from 2023 to 2025, but so did rainfall.
A rain-adjusted model
To separate weather from progress, I used Poisson regression, a model designed for counts like “days with an overflow,” which can’t be negative and are often small. The model predicts overflow days from monthly rainfall, a separate effect for each year, and a separate baseline for each permit holder (since some systems overflow far more than others). Because months from the same outfall are related, I calculated standard errors that account for that clustering.
Results are reported as rate ratios: a value of 1.0 means no change, and 0.95 means 5% fewer overflow days.
| Factor | Rate ratio (95% CI) | Meaning |
|---|---|---|
| Each extra inch of monthly rain | 1.16 (1.15–1.17) | +16% overflow days per inch |
| 2024 vs. 2023, same rainfall | 0.95 (0.93–0.97) | 5% fewer, statistically significant |
| 2025 vs. 2023, same rainfall | 1.02 (1.00–1.04) | No significant change (p = 0.10) |
 Figure 1. At the same rainfall, predicted overflow days are about the same in 2023, 2024 and 2025.
Once rainfall is accounted for, there is no sustained decline. 2024 was modestly better than 2023, but 2025 was back to 2023 levels. Most of the raw drop from 2023 to 2025 is explained by drier weather. This is not surprising, since most large control projects were still being designed or built. It does show that year-to-year overflow totals alone are not good evidence of progress.
Who lives with the overflows
Of 207 outfalls, 189 are inside overburdened communities. Their average was about 53 overflow days per year, similar to the 18 outfalls elsewhere (59 days). Because nearly all outfalls are in OBCs, the burden of slow progress falls almost entirely on those communities (my Ironbound power plant post and my Superfund post show similar concentrations for other hazards).
Why this matters
Utilities and agencies will want to show that billions in sewer investments are working. A rain-adjusted model like this one is a fairer test than comparing raw overflow counts from wet and dry years. It could also be run every year as new reports come in, letting residents judge progress for themselves.
Limitations
- Days, not volume. Reports give days with any discharge, not how much sewage was released.
- Monthly rainfall is coarse. Overflows depend on storm intensity. One cloudburst can cause more overflows than a month of drizzle. Storm-level data would sharpen the model.
- Overdispersion. Counts vary more than a basic Poisson model assumes. Clustered standard errors help, but a negative binomial model would be a useful check.
- Self-reported data from permit holders.
Code project (Level 3→4): Poisson regression
Goal: Estimate rain-adjusted changes in combined sewer overflows from 2023 to 2025.
Data: EPA ECHO discharge monitoring reports for all 21 New Jersey CSO permits (2023–2025); NJDEP outfall locations; NJDEP OBC list in effect on the cutoff date.
Method:
- Keep “Duration of discharge, monthly total” (days) for each outfall-month, and match it to the permit’s reported monthly rainfall.
- Fit a Poisson model with rainfall, year, and permit effects, and clustered standard errors.
- Exponentiate coefficients to get rate ratios.
- Plot predicted overflow days against rainfall for each year.
pois = smf.poisson("days ~ rain_in + C(year) + C(npdes_id)", data=m).fit(
    cov_type="cluster", cov_kwds={"groups": outfall_ids})
print(np.exp(pois.params))   # rate ratios
New skills: choosing a model that fits the data type (counts), interpreting rate ratios, and adjusting a trend for a confounder (weather).
Data and methods
Data sources
- EPA ECHO discharge monitoring reports for all 21 New Jersey CSO permits (2023–2025); NJDEP outfall locations; NJDEP OBC list in effect on the cutoff date.
The analysis was done in Python with public data. The full code, its data, and every figure it produces are in the code project below.
References
- New Jersey Department of Environmental Protection. (n.d.). Combined sewer overflows. https://dep.nj.gov/dwq/cso/
- Rutgers Center for Urban Policy Research. (2015). New permit system requires long-term CSO discharge reduction plans and enhanced public outreach. https://cupr.rutgers.edu/999-2/
- U.S. Environmental Protection Agency. (n.d.). Combined sewer overflows (CSOs). https://www.epa.gov/npdes/combined-sewer-overflows-csos
- U.S. Environmental Protection Agency. (2026). ECHO discharge monitoring report data: New Jersey CSO permits, 2023–2025 [Data set]. https://echo.epa.gov/trends/loading-tool/water-pollution-search