
What Do New Jersey's Factories Report Releasing? A First Look at the Toxics Release Inventory
A right to know
In December 1984, a cloud of toxic gas escaped from a pesticide plant in Bhopal, India, killing thousands of people. Many nearby residents had no idea what was being made next door. Two years later, Congress passed the Emergency Planning and Community Right-to-Know Act, which created the Toxics Release Inventory (TRI) (U.S. EPA, n.d.-a). Every year, larger industrial facilities, such as factories, refineries, power plants, and waste handlers, must report how much of each of hundreds of listed chemicals they release into the air, water, and land. New Jersey has its own Worker and Community Right to Know Act, which requires employers to share information about hazardous substances at their workplaces (NJ Department of Health, n.d.).
TRI is one of the easiest ways for anyone to see what facilities say they release. In this post, I look at New Jersey’s data for 2023, the most recent year available in January 2025.
Data
I used EPA’s TRI data file for 2023 (U.S. EPA, n.d.-b), in the version that was online on January 21, 2025 (saved by the Internet Archive). EPA updates these files when facilities correct their reports, so this is what someone could have seen at the time. I kept only amounts reported in pounds; a few chemicals, like dioxins, are reported in grams.
Findings
The big picture
In 2023, 341 New Jersey facilities filed 1,034 TRI reports (one per chemical). Together they reported:
- 4.65 million pounds released on-site: about 74% into water, 25% into the air, and 1% onto land.
- 5.24 million pounds sent off-site for disposal.
- About 5% of on-site releases were chemicals classified as carcinogens.
A few facilities dominate
The top 10 facilities account for 86% of all on-site releases:
| Facility | City | Sector | On-site releases (lb) |
|---|---|---|---|
| Phillips 66 Bayway Refinery | Linden | Petroleum | 2,829,898 |
| Chemours Chambers Works | Deepwater | Chemicals | 444,891 |
| Paulsboro Refining Co. | Paulsboro | Petroleum | 378,023 |
| Cogen Technologies Linden Venture | Linden | Electric utility | 74,601 |
| Viking Yacht Co. | New Gretna | Boat building | 72,865 |
| Avantor Performance Materials | Phillipsburg | Chemicals | 50,229 |
| DSM Nutritional Products | Belvidere | Chemicals | 39,404 |
| Linden Generating Station | Linden | Electric utility | 38,127 |
| Joint Base McGuire-Dix-Lakehurst | Burlington County | Military | 36,790 |
| Ardagh Glass | Bridgeton | Glass | 34,130 |
By industry, petroleum refining accounts for 69% of on-site releases and chemical manufacturing for 16%.
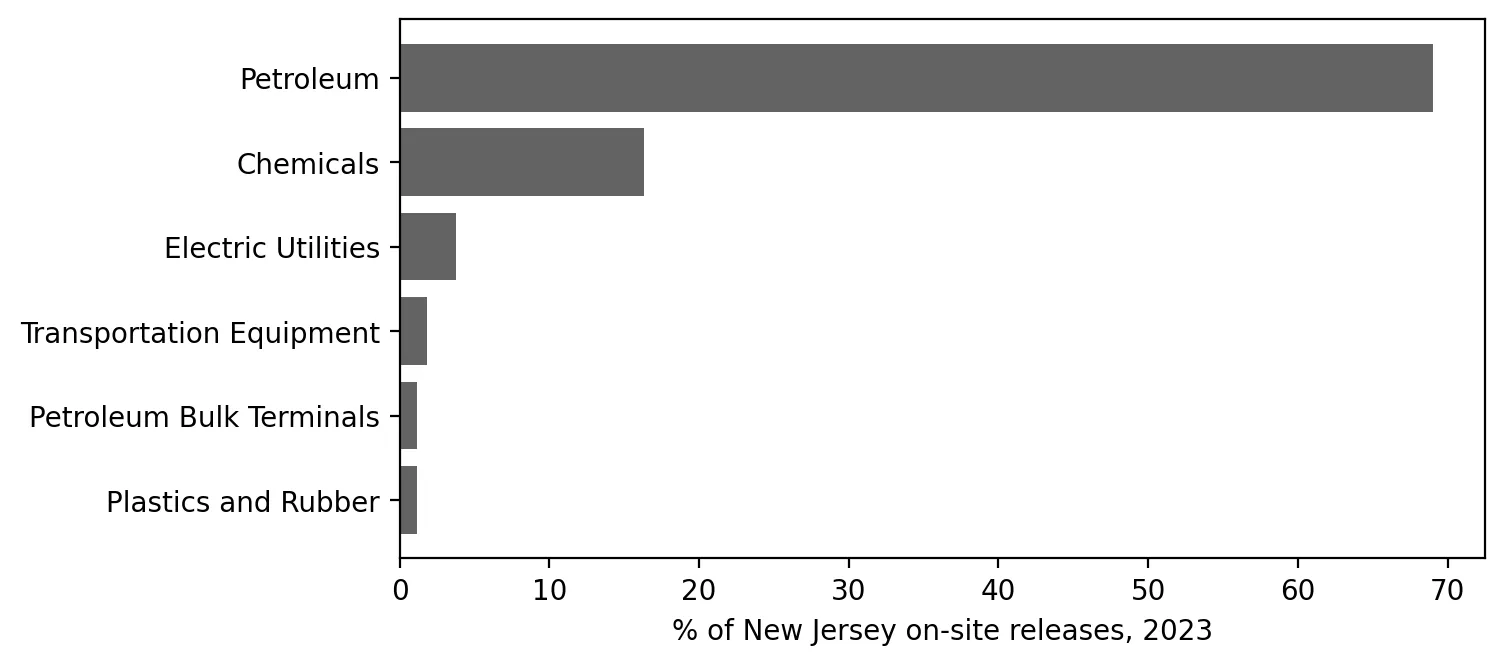 Figure 2. Petroleum refining accounts for about 69% of New Jersey’s reported on-site toxic releases.
Pounds are not the same as harm
The top chemical by weight is nitrate compounds discharged to water (3.4 million lb), mostly from the Bayway refinery. Nitrates can harm rivers and bays by feeding algae, but a pound of nitrate isn’t nearly as toxic to people as a pound of benzene. TRI reports amounts, not risk (U.S. EPA, n.d.-c).
What neighbors breathe is a different list. Air releases totaled 1.16 million lb, led by ammonia (304,000 lb), sulfuric acid (114,000 lb), styrene (113,000 lb, mainly from boat building), and toluene (77,000 lb). The largest air emitters were Bayway (228,000 lb), Cogen Technologies Linden (75,000 lb), and Viking Yacht (73,000 lb).
Where the releases are
| County | TRI facilities | On-site releases (lb) | % of NJ total | % of residents in overburdened communities |
|---|---|---|---|---|
| Union | 28 | 3,042,931 | 65% | 71% |
| Salem | 8 | 484,466 | 10% | 27% |
| Gloucester | 21 | 464,613 | 10% | 21% |
| Middlesex | 59 | 150,108 | 3% | 80% |
| Burlington | 17 | 133,227 | 3% | 41% |
| Warren | 6 | 90,523 | 2% | 25% |
 Figure 1. Union County alone accounts for nearly two-thirds of New Jersey’s on-site toxic releases.
Union County alone, home to Bayway and two large Linden power plants, accounts for nearly two-thirds of the state’s on-site releases. The 11 counties where most residents live in overburdened communities host 70% of TRI facilities and 74% of on-site releases (69% of air releases). But some big sources, like Chambers Works in Salem County and the Paulsboro refinery in Gloucester County, are in counties where most residents don’t live in overburdened communities, though the facilities themselves may sit near ones that do.
What I learned
- A handful of large facilities, especially refineries, account for most reported releases.
- Total pounds can be misleading. What is released and where it goes matter as much as how much.
- County totals are a starting point, but to know who lives next to these facilities, I need to look at a smaller scale: neighborhoods, not counties.
Limitations
- TRI doesn’t cover everything. Smaller facilities, many chemicals, and sources like cars, trucks, and ships aren’t included (U.S. EPA, n.d.-a).
- Self-reported data. Facilities estimate their own releases, often with calculations rather than direct measurements.
- Releases are not exposure. Distance, wind, and stack height determine who actually breathes or drinks a chemical.
Code project (Level 1): summarizing a big government dataset
Goal: Summarize New Jersey’s 2023 TRI reports by facility, industry, chemical, and county.
Data: EPA TRI basic data file, reporting year 2023 (archived January 21, 2025 version), filtered to New Jersey; NJDEP overburdened community list (version effective July 31, 2024 – January 30, 2025).
Steps:
- Load the file and keep only New Jersey rows reported in pounds.
- Add up air releases (stack + fugitive) and on-site totals.
- Use
groupbyto total releases by facility, sector, chemical, and county. - Calculate percentages of the statewide total.
- Add each county’s share of residents living in overburdened communities and compare.
- Make bar charts.
lbs = tri[tri["UNIT OF MEASURE"] == "Pounds"]
by_county = lbs.groupby("COUNTY")["ON-SITE RELEASE TOTAL"].sum().sort_values(ascending=False)
print((by_county / by_county.sum() * 100).round(1))
New skills: groupby summaries, percentages of a total, and comparing two tables by a shared column.
Data and methods
Data sources
- EPA TRI basic data file, reporting year 2023 (archived January 21, 2025 version), filtered to New Jersey; NJDEP overburdened community list (version effective July 31, 2024 – January 30, 2025).
The analysis was done in Python with public data. The full code, its data, and every figure it produces are in the code project below.
References
- New Jersey Department of Health. (n.d.). Right to Know. https://www.nj.gov/health/workplacehealthandsafety/right-to-know/
- New Jersey Department of Environmental Protection. (2024). Environmental Justice (EJ) Law Combined Stressor Summary 20240731 – 20250130 [Data set]. https://www.arcgis.com/home/item.html?id=12c559e017264e7ba621669bf8f948d7
- U.S. Environmental Protection Agency. (n.d.-a). What is the Toxics Release Inventory? https://www.epa.gov/toxics-release-inventory-tri-program/what-toxics-release-inventory
- U.S. Environmental Protection Agency. (n.d.-b). TRI basic data files: Calendar years 1987–present [Data set; archived copy of January 21, 2025]. https://www.epa.gov/toxics-release-inventory-tri-program/tri-basic-data-files-calendar-years-1987-present (archive: https://web.archive.org/web/20250121021328/https://data.epa.gov/efservice/downloads/tri/mv_tri_basic_download/2023_US/csv)
- U.S. Environmental Protection Agency. (n.d.-c). Factors to consider when using Toxics Release Inventory data. https://www.epa.gov/toxics-release-inventory-tri-program/factors-consider-when-using-toxics-release-inventory-data