
Ozone Season 2024: How Often Did New Jersey's Air Fail the Federal Standard?
What ozone is
High up in the stratosphere, ozone protects us from ultraviolet light. Near the ground, it is a harmful air pollutant. Ground-level ozone is not released directly from tailpipes or smokestacks. It forms when nitrogen oxides (from cars, trucks, and power plants) and volatile organic compounds (from fuels, solvents, and plants) react in sunlight. That is why ozone peaks on hot, sunny summer afternoons (U.S. EPA, n.d.-a).
Breathing ozone can cause coughing and throat irritation, make the lungs more vulnerable to infection, and trigger asthma attacks. Children, older adults, outdoor workers, and people with asthma are most at risk (U.S. EPA, n.d.-b).
New Jersey and the ozone standard
The U.S. EPA sets a national standard for ozone: the daily maximum 8-hour average should not exceed 0.070 parts per million (ppm) (U.S. EPA, n.d.-c). A region “meets” the standard when its design value, the 3-year average of each monitor’s fourth-highest day, is at or below 0.070 ppm.
Northern New Jersey has struggled with ozone for decades. It is part of the New York–Northern New Jersey–Long Island nonattainment area, which in 2022 EPA reclassified as “Severe” nonattainment under the older 2008 ozone standard because the region missed its deadline to clean up its air (U.S. EPA, 2022a, 2022b). Part of the problem is geography: ozone and the pollution that forms it travel downwind, so New Jersey’s air is affected by emissions from Pennsylvania and other states as well as from its own highways and power plants.
What 2024 looked like
I used EPA’s AirData daily file for 2024, which reports the daily maximum 8-hour ozone level at every monitor in the country, and kept New Jersey’s 17 monitors (see the code project).
Ozone exceeded the standard on 20 days in 2024. On 20 days, at least one New Jersey monitor recorded an 8-hour average above 0.070 ppm. All of them fell between May and September, with June and July the worst months (6 days each).
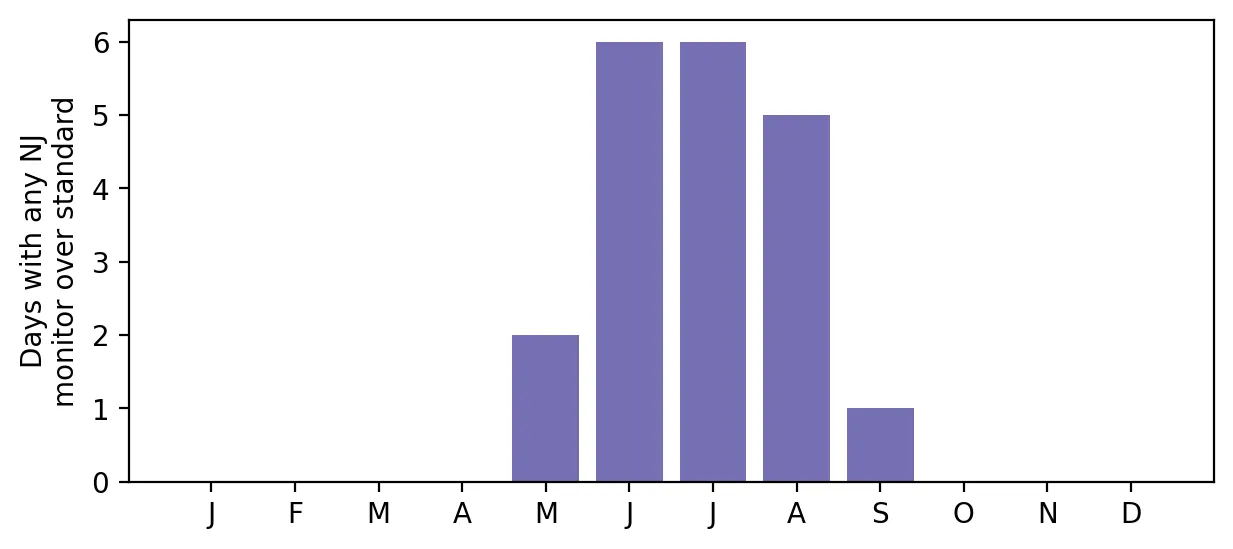 Figure 2. All 20 ozone exceedance days in 2024 fell between May and September, with June and July the worst.
Most monitors exceeded at least once. Thirteen of 17 monitors had at least one day over the standard, and six had a fourth-highest day above 0.070 ppm. That fourth-highest value is the number that feeds into the design value. The monitors with the most exceedance days were:
| Monitor | County | Days over 0.070 ppm | 4th-highest day (ppm) |
|---|---|---|---|
| Leonia | Bergen | 9 | 0.078 |
| Clarksboro | Gloucester | 8 | 0.076 |
| Rider University | Mercer | 5 | 0.076 |
| Rutgers University | Middlesex | 5 | 0.072 |
| Colliers Mills | Ocean | 4 | 0.073 |
| Washington Crossing | Mercer | 4 | 0.071 |
 Figure 1. Ozone exceedance days in 2024 varied by monitor, with high counts in both overburdened and other locations.
An environmental justice puzzle
I expected the monitors in overburdened communities to have the worst ozone. The data tell a more complicated story. Monitors located inside an overburdened community averaged 3.3 exceedance days, compared with 2.6 for other monitors, a small difference. Some of the highest readings came from suburban and rural locations like Clarksboro and Colliers Mills, in the Pinelands.
That fits the chemistry. Ozone takes hours to form, so it often peaks downwind of the cities and highways where its ingredients are released. In dense urban areas, fresh nitrogen oxide emissions can even destroy some ozone locally. This means ozone is a regional pollutant rather than a neighborhood-level one. In environmental justice terms, ozone exposure is fairly widely shared. The unequal part is vulnerability: asthma rates and access to health care are not evenly shared. Pollutants that come more directly from local sources, such as fine particles and diesel exhaust, are likely to show bigger neighborhood differences, which I plan to examine next.
Limitations
- Few monitors. Seventeen monitors cannot capture every neighborhood. My OBC comparison involves only 6 monitors in OBCs and 11 outside, too few for firm conclusions.
- Preliminary data. On February 12, 2025, 2024 data were still preliminary; states certify them by May 1. The file I downloaded later may include small corrections.
- One year. The official standard uses three-year averages, and ozone varies a lot with summer weather.
Code project (Level 1): filtering a national dataset
Goal: Count how many days each New Jersey monitor exceeded the ozone standard in 2024.
Data: U.S. EPA AirData pre-generated daily file daily_44201_2024.zip (ozone, all U.S. monitors); NJDEP OBC list in effect on the cutoff date.
Method:
- Open the national file and keep rows where the state code is 34 (New Jersey).
- Use the “1st Max Value” column: the daily maximum 8-hour average, which is the statistic the standard uses.
- For each monitor, count days above 0.070 ppm and find the fourth-highest day.
- Use a spatial join to check whether each monitor sits inside an OBC.
nj = df[df["State Code"] == "34"]
daily = nj.groupby(["site_id", "Date Local"])["1st Max Value"].max()
days_over = (daily > 0.070).groupby("site_id").sum()
A mistake I caught: My first version used the “Arithmetic Mean” column, which is the average of all the 8-hour periods in a day, not the maximum. It showed zero exceedances all year. Reading the data documentation and choosing the right column changed the answer completely.
Data and methods
Data sources
- U.S. EPA AirData pre-generated daily file daily_44201_2024.zip (ozone, all U.S. monitors); NJDEP OBC list in effect on the cutoff date.
The analysis was done in Python with public data. The full code, its data, and every figure it produces are in the code project below.
References
- U.S. Environmental Protection Agency. (n.d.-a). Ground-level ozone basics. https://www.epa.gov/ground-level-ozone-pollution/ground-level-ozone-basics
- U.S. Environmental Protection Agency. (n.d.-b). Health effects of ozone pollution. https://www.epa.gov/ground-level-ozone-pollution/health-effects-ozone-pollution
- U.S. Environmental Protection Agency. (n.d.-c). NAAQS table. https://www.epa.gov/criteria-air-pollutants/naaqs-table
- U.S. Environmental Protection Agency. (2022a). Fact sheet: Final determinations of attainment and reclassifications for the 2008 ozone NAAQS. https://19january2025snapshot.epa.gov/system/files/documents/2022-09/Fact%20Sheet%20NFRM%202008%20Ozone%20Determinations%20final_1.pdf
- U.S. Environmental Protection Agency. (2022b). Determinations of attainment by the attainment date, extensions of the attainment date, and reclassification of areas classified as serious for the 2008 ozone NAAQS [Federal Register document 2022-20458]. https://public-inspection.federalregister.gov/2022-20458.pdf
- U.S. Environmental Protection Agency. (2025). AirData pre-generated data files: Daily ozone (44201), 2024 [Data set]. https://aqs.epa.gov/aqsweb/airdata/download_files.html