
A New Map of Burden: What Changed When New Jersey Updated Its Overburdened Communities
The update
On March 31, 2026, NJDEP updated its Environmental Justice Mapping, Assessment and Protection tool (EJMAP). The new version redraws the list of overburdened communities using 2024 American Community Survey data and refreshes the environmental stressor data. NJDEP announced that the tool would default to the new layers, keeping older versions available as archives (NJDEP, 2026a). The law requires NJDEP to update the list at least every two years, so these updates are routine. But each one changes which neighborhoods get the law’s protections.
Because NJDEP keeps the old version online, it’s possible to compare the two block group by block group.
Method: change detection
I matched each of New Jersey’s 6,585 block groups (after removing a handful of duplicate IDs) between the old version (in effect January 31, 2025 – March 30, 2026) and the new one. I classified each block group into one of three statuses:
- Not an OBC;
- OBC, subject to adverse cumulative stressors (the law’s strictest category; see my post on the appeals court ruling);
- OBC, not subject to adverse cumulative stressors.
Then I built a transition table showing how block groups moved between categories.
Findings
The transition table
| Old status ↓ / New status → | Not OBC | OBC, adverse cumulative | OBC, not adverse | Total (old) |
|---|---|---|---|---|
| Not OBC | 2,696 | 186 | 82 | 2,964 |
| OBC, adverse cumulative | 136 | 2,903 | 76 | 3,115 |
| OBC, not adverse | 71 | 67 | 368 | 506 |
| Total (new) | 2,903 | 3,156 | 526 | 6,585 |
Most block groups kept their status (the diagonal: 2,696 + 2,903 + 368 = 5,967, or 91%). But 618 block groups (9%) changed category.
More added than removed
- 268 block groups were added to the OBC list and 207 were removed, a net gain of 61.
- The number of residents living in OBCs rose from about 5.23 million to 5.39 million.
- Changes were scattered statewide, with the most in Bergen (46 added, 36 removed), Middlesex, Monmouth, Essex, and Passaic counties.
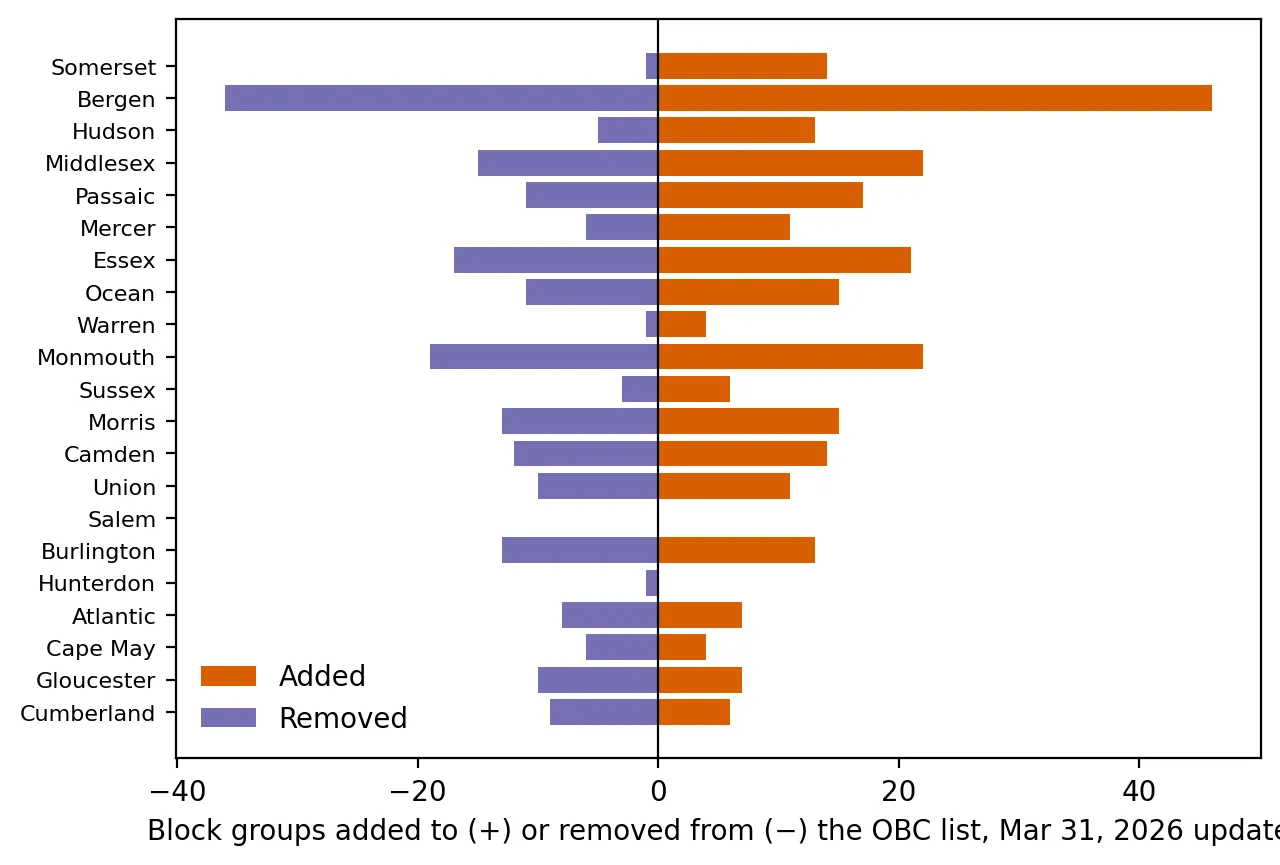 Figure 1. Block groups added to and removed from the overburdened community list, by county.
 Figure 2. Changes to the overburdened community list are scattered statewide rather than concentrated in one region.
Why status changed: mostly the minority threshold
For each change, I checked which threshold was crossed:
| Minority crossed the 40% line | Income crossed the 35% line | Both | |
|---|---|---|---|
| Added (268) | 216 | 37 | 14 |
| Removed (207) | 152 | 38 | 15 |
About 80% of additions and 73% of removals involved the minority criterion. That fits what my post on how the overburdened line is drawn found: the 40% minority line determines most of the map.
Big swings suggest survey noise
In block groups that were added, the minority share rose by a median of 9.4 percentage points. In those removed, it fell by 8.8 points. Real neighborhoods can change, but swings that large over a few years are more likely to reflect sampling error in the American Community Survey, whose estimates for areas as small as block groups often carry margins of error of 10 points or more. Many of these block groups were simply near the threshold and moved across it. That means some communities’ legal status flips back and forth from one update to the next for statistical reasons rather than real change.
Stressor totals shifted too
For the 3,414 block groups that were OBCs in both versions, the average Combined Stressor Total barely changed (16.84 to 16.69), but 66% saw their individual total change by at least one stressor as NJDEP refreshed the environmental data. Some moved into, and some out of, the “adverse cumulative stressors” category (67 and 76 respectively).
Why this matters
For a factory or power plant seeking a permit, the version of the map in effect on the day it applies can decide whether the law’s extra requirements apply. For residents, a neighborhood can gain or lose protections because of survey noise. One possible improvement would be smoothing: requiring a block group to cross a threshold in two consecutive updates before its status changes, or using margins of error to identify “too close to call” areas. Another would be publishing a transition table like this one with every update, so the public can see exactly what changed.
Limitations
- Survey error is inferred, not measured. NJDEP’s files don’t include margins of error, so I can’t say for certain which changes are noise.
- Duplicates. A small number of block group IDs appear twice in NJDEP’s files. I kept the record with the larger population.
- Two snapshots. This compares only two versions. A longer series would show which areas flip repeatedly.
Code project (Level 4): change detection
Goal: Measure what changed between two versions of NJDEP’s environmental justice dataset, and why.
Data: NJDEP EJ Law Combined Stressor Summary, version effective Jan 31, 2025 – Mar 30, 2026, and the version effective Mar 31, 2026 (both public on the cutoff date).
Method:
- Load both versions with the shared
vintageshelper. - Check for and remove duplicate IDs. This was my first draft’s bug: duplicates inflated the counts.
- Merge on GEOID with
indicator=Trueto confirm every block group matched. - Assign each block group a three-level status in each version and build a transition table with
pd.crosstab. - For each added or removed OBC, identify which threshold was crossed.
m = old[cols].merge(new[cols], on="GEOID", suffixes=("_old", "_new"), indicator=True)
pd.crosstab(m.status_old, m.status_new, margins=True)
New skills: comparing dataset versions, transition matrices, and data-quality checks (duplicates, matching).
Data and methods
Data sources
- NJDEP EJ Law Combined Stressor Summary, version effective Jan 31, 2025 – Mar 30, 2026, and the version effective Mar 31, 2026 (both public on the cutoff date).
The analysis was done in Python with public data. The full code, its data, and every figure it produces are in the code project below.
References
- New Jersey Department of Environmental Protection. (2026a, March 31). Site Remediation listserv notice: EJMAP update [Notice of updated OBC/ABG determinations based on the 2024 ACS]. https://dep.nj.gov/wp-content/uploads/srp/listserv-archives/20260331_srra.pdf
- New Jersey Department of Environmental Protection. (2026b). Environmental Justice (EJ) Law Combined Stressor Summary (Current) [Data set, effective Mar 31, 2026]. https://www.arcgis.com/home/item.html?id=8f1eeb5074d147af8ab3e5e5a4f72d2b
- New Jersey Department of Environmental Protection. (2025). Environmental Justice (EJ) Law Combined Stressor Summary (version effective Jan 31, 2025 – Mar 30, 2026) [Data set]. https://www.arcgis.com/home/item.html?id=8a9ae7bae7a0458fb0f8d3759b145257
- New Jersey Department of Environmental Protection. (n.d.). Environmental justice law. https://dep.nj.gov/ej/law/
- U.S. Census Bureau. (n.d.). American Community Survey: Sample size and data quality. https://www.census.gov/programs-surveys/acs/methodology/sample-size-and-data-quality.html