
Living Next to Industry: Who Lives Within a Mile of a Toxic-Release Facility?
Why now
May is Asthma Awareness Month (U.S. EPA, n.d.-a). Asthma attacks can be triggered by air pollution, including irritating chemicals released by industrial facilities. Many of the chemicals that New Jersey facilities report to EPA’s Toxics Release Inventory (TRI), such as ammonia, sulfuric acid, and styrene, irritate the lungs.
In my Toxics Release Inventory post, I looked at how much New Jersey’s TRI facilities release and found that counties where most residents live in overburdened communities host 70% of TRI facilities. But counties are big. This post zooms in to the neighborhood level and asks: who lives within a mile of a facility that reports toxic chemical releases? And does the answer hold up when comparing neighborhoods in the same county?
Data
- Facilities: the 341 New Jersey facilities that reported to TRI for 2023, using the most recent TRI data file saved by the Internet Archive (January 2025). Of these, 166 reported at least one chemical classified as a carcinogen (U.S. EPA, n.d.-b).
- Neighborhoods: NJDEP’s overburdened community data in the version in effect in May 2026 (NJDEP, 2026).
For each neighborhood, I measured the distance from its center to the nearest TRI facility.
Findings
About 1.9 million overburdened community residents live within a mile of a TRI facility
| Overburdened community residents | Other residents | |
|---|---|---|
| Within 1 mile of any TRI facility | 35% (1.9 million people) | 10% |
| Within 1 mile of a facility reporting carcinogens | 21% (1.2 million people) | 6% |
| Median distance to the nearest TRI facility | 1.3 miles | 2.8 miles |
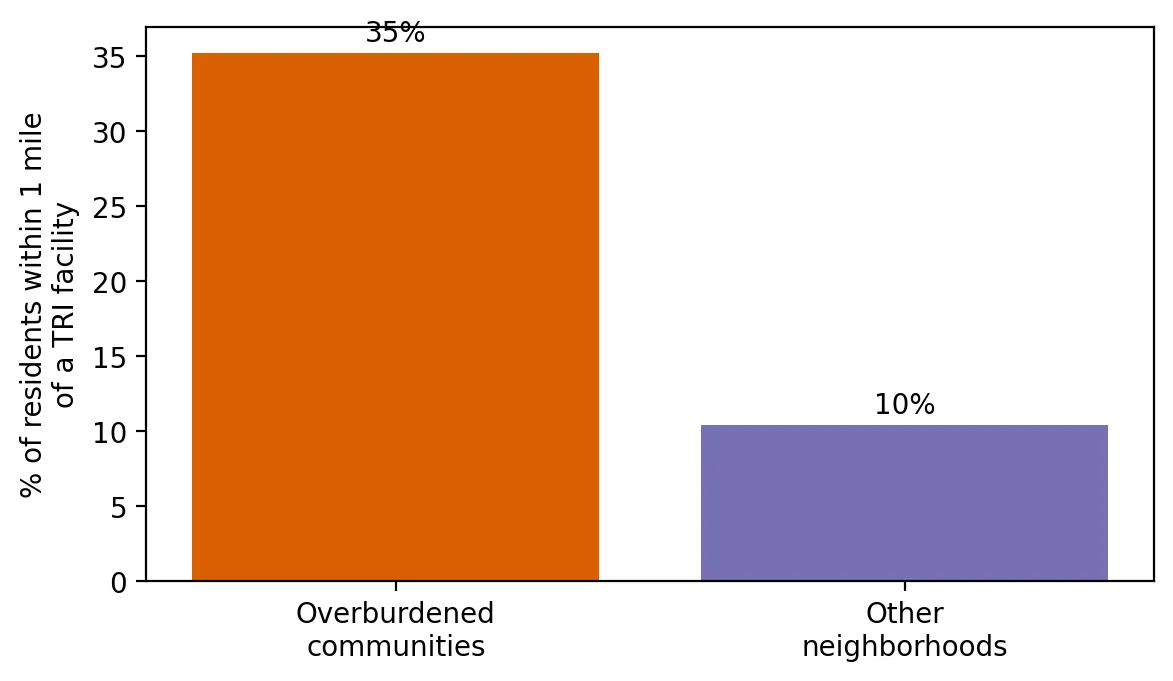 Figure 2. Overburdened community residents are far more likely to live within a mile of a toxic release facility.
Residents of overburdened communities are about 3.5 times as likely to live within a mile of a toxic-release facility. The typical overburdened neighborhood is less than half as far from one.
Logistic regression: does the gap hold within counties?
Logistic regression is used when the outcome is yes-or-no, here is there a TRI facility within 1 mile? It reports an odds ratio: how many times higher the odds are for one group than another. An odds ratio of 1 means no difference.
| Model | Odds ratio | 95% confidence interval |
|---|---|---|
| Overburdened vs. other neighborhoods | 4.4 | 3.1–6.3 |
| Same comparison, within the same county | 3.3 | 2.3–4.7 |
| Each +10 points in % people of color (same county, same income) | 1.17 | 1.09–1.26 |
| Each +10 points in % low-income households (same county, same race) | 1.18 | 1.08–1.29 |
| Facilities reporting carcinogens: overburdened vs. other (same county) | 2.9 | 1.6–5.0 |
Even comparing neighborhoods within the same county, overburdened communities have 3.3 times the odds of having a TRI facility within a mile. Race and income each matter on their own: a higher share of residents of color and a higher share of low-income households both raise the odds, even when the other is held constant. All results are statistically significant (p < 0.001). I used cluster-robust standard errors by county, so the confidence intervals account for neighborhoods in the same county being similar.
What the model predicts
 Figure 1. The predicted chance of a nearby toxic release facility rises with the share of residents who are people of color.
Using the model, a neighborhood in Bergen County with average income has about a 21% chance of a TRI facility within a mile if almost none of its residents are people of color. That rises to about 38% at 50% people of color and 57% at nearly 100%, with income held the same.
Why this matters
Living within a mile of a facility doesn’t mean a person is exposed to dangerous levels of a chemical. But it means more truck traffic, more risk from leaks and accidents, and more chances for emissions to reach homes, schools, and playgrounds. These results show that the chance of living near a toxic-release facility in New Jersey depends strongly on a neighborhood’s racial makeup and income, even after accounting for which county it’s in.
Limitations
- Proximity isn’t exposure, and TRI doesn’t cover every polluting facility or chemical.
- One year of facilities. I used the 2023 TRI list, the most recent archived version.
- Neighborhood centers. Distance is measured from each block group’s center point.
- Odds ratios overstate risk ratios when an outcome is common. Here, the simple share comparison (35% vs. 10%) gives the plain-language picture.
Code project (Level 4): logistic regression
Goal: Test whether overburdened communities and communities of color are more likely to live within a mile of a TRI facility, comparing neighborhoods within the same county.
Data: EPA TRI 2023 (Internet Archive copy, January 21, 2025), New Jersey facilities; NJDEP OBC data (version effective March 31, 2026).
Steps:
- Build a list of TRI facilities with locations and whether they report carcinogens.
- Use a KD-tree to find the distance from every neighborhood to the nearest facility.
- Create a yes/no outcome: facility within 1 mile.
- Fit logistic regressions with county fixed effects and county-clustered standard errors.
- Convert coefficients to odds ratios and plot predicted probabilities.
m = smf.logit("near_any ~ minority10 + lowinc10 + C(COUNTY)", d).fit(cov_type="cluster", cov_kwds={"groups": county_codes})
np.exp(m.params)                                         # odds ratios
m.predict(grid)                                          # predicted chance at different % people of color
New skills: modeling yes/no outcomes, odds ratios, and predicted probabilities.
Data and methods
Data sources
- EPA TRI 2023 (Internet Archive copy, January 21, 2025), New Jersey facilities; NJDEP OBC data (version effective March 31, 2026).
The analysis was done in Python with public data. The full code, its data, and every figure it produces are in the code project below.
References
- New Jersey Department of Environmental Protection. (2026). Environmental Justice (EJ) Law Combined Stressor Summary (Current) [Data set]. https://www.arcgis.com/home/item.html?id=8f1eeb5074d147af8ab3e5e5a4f72d2b
- U.S. Environmental Protection Agency. (n.d.-a). Asthma Awareness Month. https://www.epa.gov/asthma/asthma-awareness-month
- U.S. Environmental Protection Agency. (n.d.-b). TRI basic data files: Calendar years 1987–present [Data set; Internet Archive copy of January 21, 2025]. https://web.archive.org/web/20250121021328/https://data.epa.gov/efservice/downloads/tri/mv_tri_basic_download/2023_US/csv