
One Bad Day: Who Lives Near New Jersey's High-Risk Chemical Facilities?
The risk of a single bad day
Most pollution is a slow, everyday burden. Chemical accidents are different: a fire, explosion, or toxic gas release can harm a whole neighborhood in one afternoon. Facilities that store large amounts of especially dangerous chemicals, such as refineries, chemical plants, and water treatment plants using chlorine, must file a Risk Management Plan (RMP) with EPA explaining how they’ll prevent and respond to accidents.
Hurricane season began on June 1, and storms can knock out power and flood facilities. In March 2024, EPA finalized a rule requiring RMP facilities to plan explicitly for natural hazards and power loss, including backup power for release-monitoring equipment (U.S. EPA, n.d.-a). In February 2026, EPA proposed rescinding those natural-hazard and backup-power requirements. Public comments closed on May 11, 2026 (U.S. EPA, n.d.-b).
Whether those protections stay or go matters most to the people who live closest to these facilities. So who are they?
Data
- EJScreen’s chemical-facility proximity indicator: for every block group, EPA counted RMP facilities within about 3 miles (5 km), weighting closer ones more heavily (U.S. EPA, 2024). I used the final public version (2.32), saved by the Internet Archive on February 5, 2025, the day EPA took EJScreen offline (see my EJScreen post).
- NJDEP’s emergency-planning-sites stressor (version in effect from March 31, 2026), an independent state measure of nearby facilities that store hazardous substances, which I used as a cross-check (NJDEP, 2026).
Findings
Three times as likely to live near the most chemical-hazard facilities
I marked the top 20% of New Jersey neighborhoods with the most chemical-hazard facilities nearby. If these facilities were spread evenly, about 20% of every kind of neighborhood would be in that group. Instead:
| Overburdened communities | Other neighborhoods | |
|---|---|---|
| In the top 20% for nearby chemical-hazard facilities | 29% | 9% |
| Residents living in those neighborhoods | 1.53 million | 330,000 |
| Average proximity score | 0.51 | 0.21 (2.4× lower) |
More than 4 out of 5 people living in New Jersey’s most chemical-hazard-dense neighborhoods live in overburdened communities.
It rises with the share of people of color
| Neighborhoods grouped by % people of color | Avg. % people of color | % in the top 20% for chemical hazards |
|---|---|---|
| Fewest | 8% | 7% |
| 2nd | 23% | 10% |
| Middle | 41% | 17% |
| 4th | 66% | 31% |
| Most | 92% | 35% |
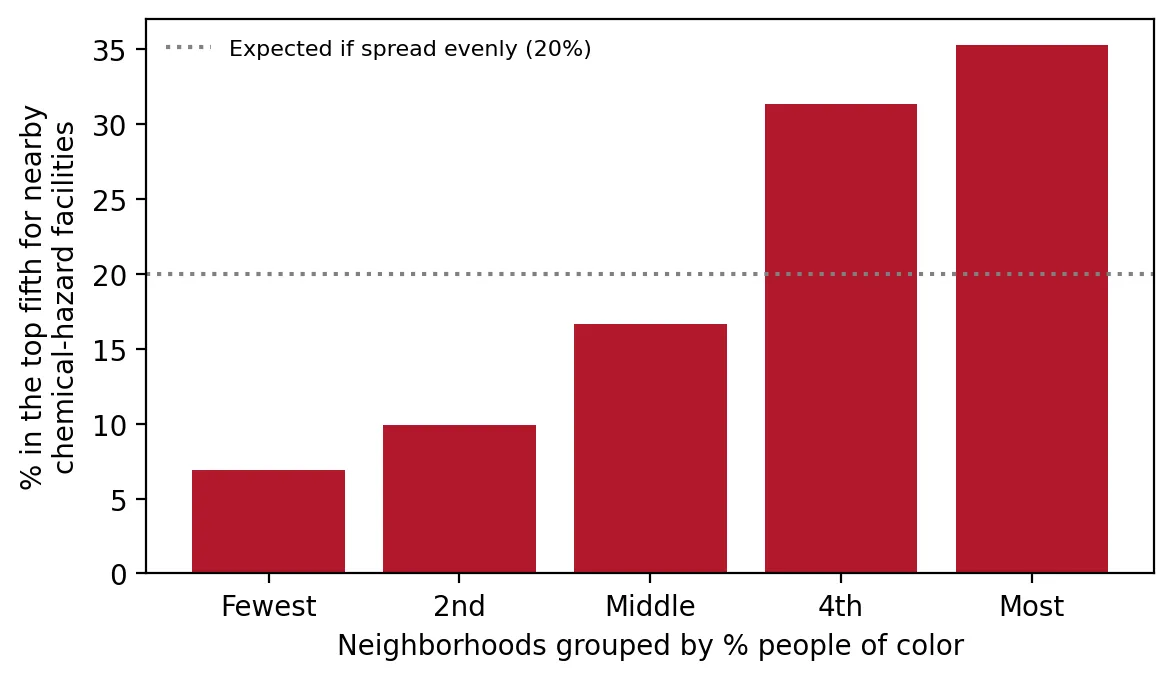 Figure 1. Neighborhoods with more people of color are much more likely to be among the most chemical-hazard-dense.
Neighborhoods where most residents are people of color are five times as likely as the least diverse neighborhoods to be among the most chemical-hazard-dense.
Holding up to tougher tests
Within the same county. A logistic regression with county fixed effects compares neighborhoods only with others in the same county. Overburdened communities still have 3.4 times the odds of being in the top 20% (95% CI 2.2–5.4, p < 0.001).
Cluster bootstrap. To make sure a few counties aren’t driving the result, I resampled whole counties with replacement 1,000 times and recalculated the gap each time. The gap of 20 percentage points had a 95% confidence interval of 7.6 to 31.0 points. It never came close to zero.
 Figure 2. Resampling counties 1,000 times shows the 20-point gap is not driven by a few counties.
A second data source. NJDEP’s own emergency-planning-sites measure, built separately from EPA’s, shows the same pattern: overburdened communities average 3.2 times the score of other neighborhoods, and 90% have at least one such site nearby, compared with 68% of other neighborhoods.
Why this matters
If a chemical facility has a fire, leak, or explosion during a storm or power outage, the people at greatest risk live right next to it. In New Jersey, those people are disproportionately residents of overburdened communities and communities of color. Rolling back requirements to plan for natural hazards and keep monitoring equipment powered would shift more risk onto the neighborhoods already living closest to it.
Limitations
- Proximity, not probability. Living near an RMP facility doesn’t mean an accident will happen. Facilities vary greatly in what they store and how safely they operate.
- Data age. EJScreen’s facility data predate its removal in February 2025, and newer facility lists aren’t included.
- The top-20% cutoff is a choice, but the average scores and the NJDEP cross-check point the same way.
Code project (Level 4): logistic regression and the cluster bootstrap
Goal: Test whether overburdened communities are more likely to be among New Jersey’s most chemical-hazard-dense neighborhoods, and how confident we can be.
Data: EJScreen 2.32 RMP proximity indicator (Internet Archive copy, February 5, 2025), New Jersey block groups; NJDEP EJ data (version effective March 31, 2026).
Steps:
- Merge EJScreen and NJDEP data by block group ID.
- Mark the top 20% for chemical-facility proximity.
- Fit logistic regressions with and without county fixed effects.
- Run a cluster bootstrap: resample whole counties 1,000 times and recompute the gap each time.
- Cross-check with NJDEP’s emergency-planning-sites stressor.
for _ in range(1000):
    pick = rng.choice(counties, len(counties), replace=True)        # resample whole counties
    s = pd.concat([d[d.COUNTY == c] for c in pick])
    gaps.append(s.rmp_top20[s.is_obc].mean() - s.rmp_top20[~s.is_obc].mean())
np.percentile(gaps, [2.5, 97.5])                                    # 95% confidence interval
New skills: bootstrapping by groups, logistic regression with fixed effects, and cross-checking with independent data.
Data and methods
Data sources
- EJScreen 2.32 RMP proximity indicator (Internet Archive copy, February 5, 2025), New Jersey block groups; NJDEP EJ data (version effective March 31, 2026).
The analysis was done in Python with public data. The full code, its data, and every figure it produces are in the code project below.
References
- New Jersey Department of Environmental Protection. (2026). Environmental Justice (EJ) Law Combined Stressor Summary (Current) [Data set]. https://www.arcgis.com/home/item.html?id=8f1eeb5074d147af8ab3e5e5a4f72d2b
- U.S. Environmental Protection Agency. (2024). EJScreen 2.32 block group data with state percentiles [Data set; Internet Archive copy of February 5, 2025]. https://web.archive.org/web/20250205213739/https://gaftp.epa.gov/ejscreen/2024/2.32_August_UseMe/EJSCREEN_2024_BG_StatePct_with_AS_CNMI_GU_VI.csv.zip
- U.S. Environmental Protection Agency. (n.d.-a). Risk Management Program Safer Communities by Chemical Accident Prevention final rule. https://www.epa.gov/rmp/risk-management-program-safer-communities-chemical-accident-prevention-final-rule
- U.S. Environmental Protection Agency. (n.d.-b). Fact sheet: Common sense approach to chemical accident prevention, Risk Management Program proposed rule. https://www.epa.gov/rmp/fact-sheet-common-sense-approach-chemical-accident-prevention-risk-management-program-proposed