
Measuring Heat Vulnerability: Who Is Most at Risk When the Next Heat Wave Hits?
Why a vulnerability index?
Heat waves are getting more frequent, and New Jersey’s 2024 Extreme Heat Resilience Action Plan calls for identifying the communities most at risk so that cooling centers, outreach, and tree planting can be targeted (NJDEP, 2024). But “most at risk” depends on more than temperature. Public health researchers describe heat vulnerability as a combination of three things (Reid et al., 2009; CDC, n.d.):
- Exposure: how hot a place gets.
- Sensitivity: how many people are physically more vulnerable, such as older adults and young children.
- Adaptive capacity: how able people are to protect themselves, which depends on income (for air conditioning and electricity), language (for understanding warnings), and surroundings such as shade.
A heat vulnerability index combines these into a single score for each neighborhood. With the start of summer 2026, I built one for every New Jersey block group using data available in June 2026.
Building the index
| Domain | Measure | Source |
|---|---|---|
| Exposure | Summer 2025 land surface temperature (relative) | Landsat 8/9 (my own calculation; see my satellite heat post) |
| Sensitivity | % residents age 65+; % under age 5 | Census ACS 2020–2024 (released Dec 2025) |
| Adaptive capacity | % low-income households; % limited-English households; lack of tree canopy | NJDEP EJ data (Mar 2026) |
Each measure has different units (degrees, percentages), so I converted them to z-scores: how many standard deviations a block group is above or below the state average. I then averaged them. My main version gives each of the three domains equal weight, and I compared it with two alternatives: all six measures weighted equally, and exposure alone.
Findings
The most vulnerable places
The 640 block groups in the top 10% of the index are home to about 895,000 people, and 95% of them are overburdened communities, compared with 57% statewide. They are concentrated in a familiar set of cities: Newark (80 block groups), Paterson (67), Elizabeth (55), Passaic (33), Trenton (32), Jersey City (27), Camden (24), Union City, Bayonne, and Atlantic City.
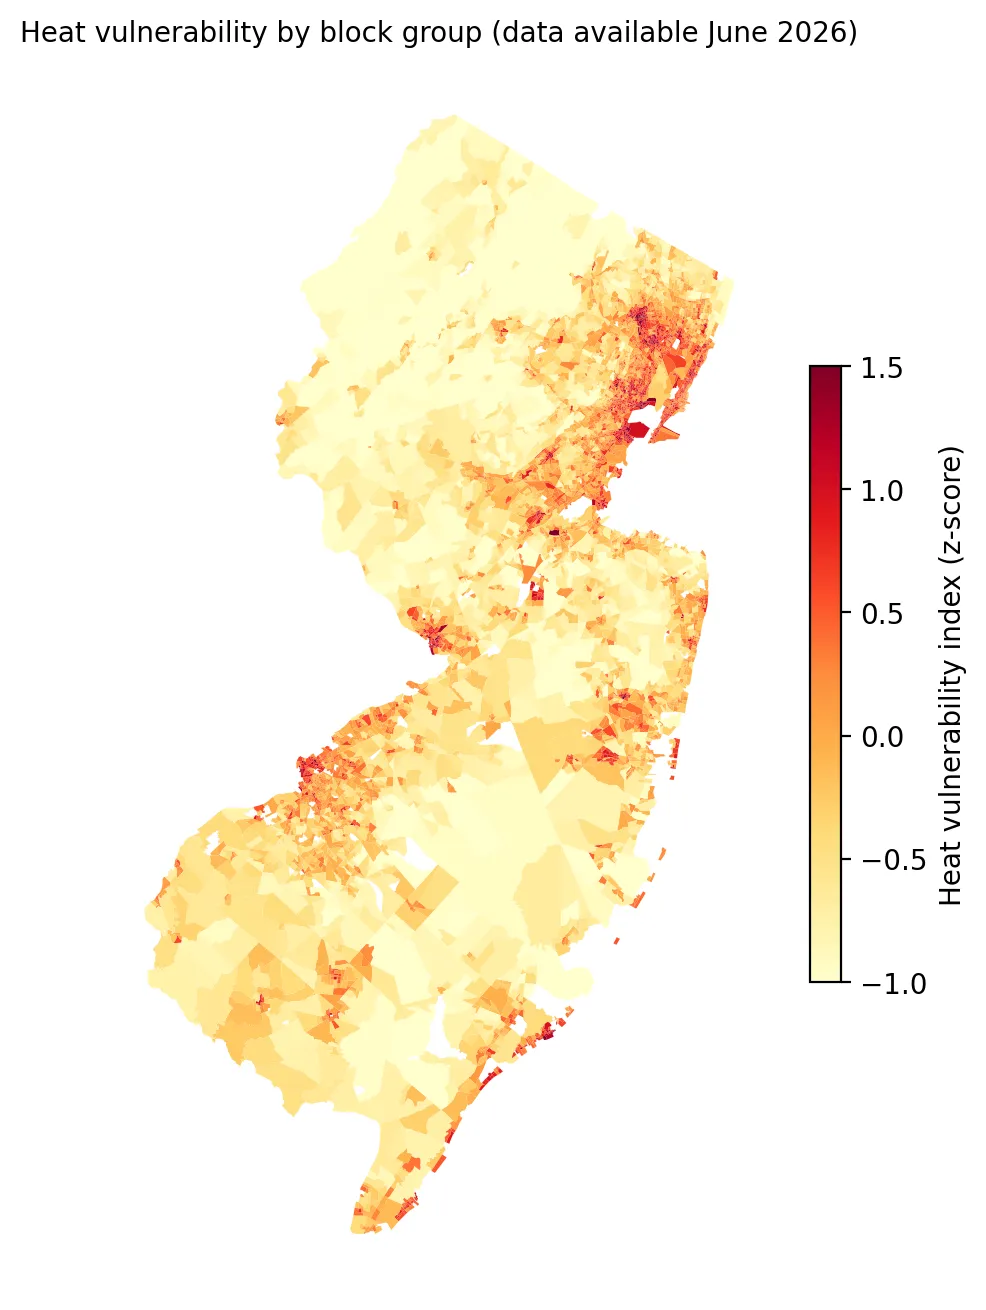 Figure 1. Heat vulnerability is highest in New Jersey’s major cities and lowest in rural and forested areas.
What makes them vulnerable
| Component | Average z-score in the top 10% |
|---|---|
| Limited English | +1.77 |
| Low income | +1.47 |
| Heat exposure | +1.24 |
| Lack of tree canopy | +1.16 |
| Under age 5 | +0.87 |
| Age 65+ | −0.05 |
 Figure 2. The most vulnerable neighborhoods are high on limited English, low income, heat and lack of tree canopy, but not on older adults.
The most vulnerable neighborhoods are hot, poor, linguistically isolated, and short on shade, and they have many young children. Interestingly, they do not have more older adults. Seniors are spread across the state and are slightly more common in cooler suburban areas (ρ = −0.22 between age 65+ and heat exposure). That is a real challenge for heat planning: an index that heavily weights age would point toward different neighborhoods than one that weights heat and poverty.
Is the index robust?
- Equal weights vs. domain weights: rankings were nearly identical (Spearman’s ρ = 0.99), and 90% of the top-10% block groups were the same.
- Exposure only vs. full index: ρ = 0.84. Adding social factors reshuffles the rankings meaningfully, which is the point of an index.
I also noticed that heat exposure and lack of tree canopy are very strongly correlated (ρ = 0.90). Including both partly double-counts the same physical factor. A more careful index might combine them, or use principal component analysis to handle overlap. I plan to try that in a later post.
Why this matters
An index like this can guide where cities place cooling centers, where outreach workers go door to door during heat emergencies, which buildings get priority for cool roofs and air conditioning assistance, and where trees get planted. It also shows that heat vulnerability is concentrated in the same overburdened communities identified by the Environmental Justice Law, even though the law itself was not designed around heat.
Limitations
- No air conditioning data. Whether a household has working air conditioning may be the single most important factor, but no public block-group data exist for New Jersey.
- Equal weights are a judgment call. Different weights reflect different values. I showed that rankings were robust to two reasonable alternatives.
- Surface temperature measures pavement and roofs, not the air indoors, where many heat deaths occur.
- Survey error in ACS estimates for small areas.
Code project (Level 5): building a composite index
Goal: Build and test a block-group heat vulnerability index for New Jersey.
Data: Landsat 8/9 Collection 2 Level-2 summer 2025 scenes (block-group surface temperature via common/lst.py); ACS 2024 5-year table B01001 from the Census Bureau’s table-based summary file (no API key needed); NJDEP EJ data (version effective Mar 31, 2026).
Method:
- Compute each block group’s summer 2025 surface temperature relative to each scene’s average.
- Parse table B01001 (pipe-delimited) to get the share of residents age 65+ and under 5.
- Standardize six measures as z-scores and average them by domain.
- Compare rankings under different weights (Spearman ρ, top-10% overlap).
- Summarize the most vulnerable block groups by municipality (spatial join) and OBC status.
z = (d[cols] - d[cols].mean()) / d[cols].std()
hvi = (z.heat + (z.age65 + z.under5) / 2 + (z.low_income + z.lim_english + z.no_canopy) / 3) / 3
New skills: composite indicators, standardization, weighting sensitivity, and recognizing redundant components.
Data and methods
Data sources
- Landsat 8/9 Collection 2 Level-2 summer 2025 scenes (block-group surface temperature via common/lst.py); ACS 2024 5-year table B01001 from the Census Bureau's table-based summary file (no API key needed); NJDEP EJ data (version effective Mar 31, 2026).
The analysis was done in Python with public data. The full code, its data, and every figure it produces are in the code project below.
References
- Centers for Disease Control and Prevention. (n.d.). Heat and health. https://www.cdc.gov/heat-health/
- New Jersey Department of Environmental Protection. (2024, July). State of New Jersey resilience action plan: Extreme heat [Appendix]. https://dep.nj.gov/wp-content/uploads/climatechange/extreme_heat_rap_appendix_-071224_final.pdf
- Reid, C. E., O'Neill, M. S., Gronlund, C. J., Brines, S. J., Brown, D. G., Diez-Roux, A. V., & Schwartz, J. (2009). Mapping community determinants of heat vulnerability. Environmental Health Perspectives, 117(11), 1730–1736. https://doi.org/10.1289/ehp.0900683
- U.S. Census Bureau. (2026). American Community Survey 2020–2024 5-year estimates, table-based summary file: B01001 [Data set]. https://www2.census.gov/programs-surveys/acs/summary_file/2024/table-based-SF/
- U.S. Geological Survey. (2025). Landsat 8–9 Collection 2 Level-2 [Data set], via Microsoft Planetary Computer. https://planetarycomputer.microsoft.com/dataset/landsat-c2-l2
- New Jersey Department of Environmental Protection. (2026). Environmental Justice (EJ) Law Combined Stressor Summary (Current) [Data set]. https://www.arcgis.com/home/item.html?id=8f1eeb5074d147af8ab3e5e5a4f72d2b