
The July Heat Wave: Mapping New Jersey's Heat Hot Spots
A deadly week
From July 2 to 6, 2026, a prolonged heat wave gripped New Jersey. By July 4, state health officials were investigating 19 suspected heat-related deaths (NBC New York, 2026). By July 7, the count had reached 29, most of them still preliminary pending official certification (The Watchers, 2026).
In the previous post (my heat vulnerability post), I built a heat vulnerability index. This post focuses on the geography of heat itself. Are hot neighborhoods scattered randomly, or do they form large, connected clusters? Clusters matter: a hot block surrounded by other hot blocks gets no relief from cooler surroundings, and clusters make it easier to target help.
Data
Landsat did not capture a clear view of New Jersey during the July 2–6 heat wave. Its only passes over the state in that window, on July 6 and the day after, were almost completely cloud-covered. I used the clear portions of June 2026 Landsat scenes (June 5, 13, 29, and 30), masking out cloudy pixels, to measure each block group’s surface temperature relative to the statewide average. On those clear June days, the average block group’s surface reached 38°C (100°F), and the hottest 1% exceeded 46.6°C (116°F).
Hot spots are very stable from year to year. June 2026 rankings closely matched summer 2025 (Spearman’s ρ = 0.94), so the places that were hottest in June were almost certainly hottest during the heat wave too.
Method: spatial autocorrelation
Spatial autocorrelation measures whether nearby places have similar values. I used two tools:
- Global Moran’s I summarizes clustering across the whole state. It ranges from about −1 (neighbors are opposites) through 0 (random) to +1 (neighbors are very similar).
- Local Moran’s I (LISA) tests each block group: is it a hot place surrounded by hot neighbors (a hot spot), a cool place surrounded by cool neighbors (a cold spot), or an outlier? Significance comes from shuffling values randomly 999 times and checking whether the real pattern stands out.
“Neighbors” are block groups that share a border or corner (queen contiguity).
Findings
Heat is highly clustered
Global Moran’s I = 0.84 (p = 0.001). That is very strong clustering: hot block groups are almost always next to other hot block groups. The Moran scatterplot shows a tight upward pattern, where hotter places have hotter neighbors.
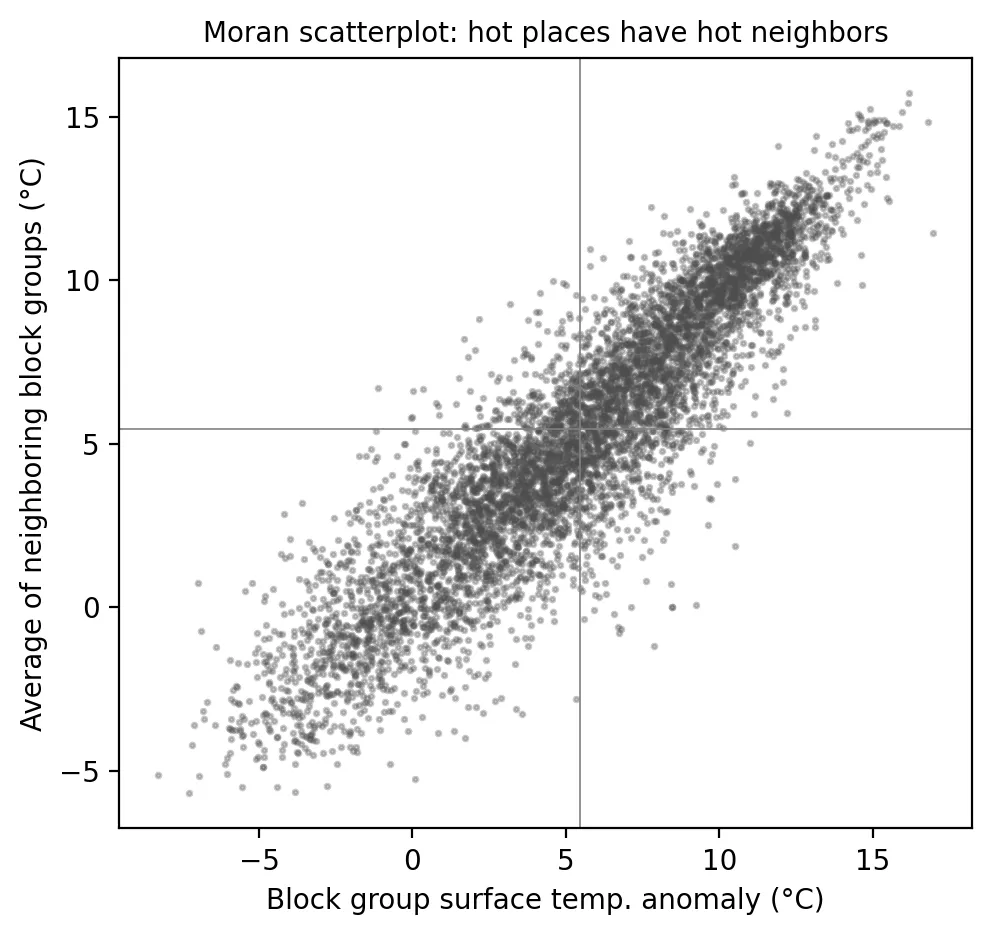 Figure 2. Hot block groups are surrounded by other hot block groups, indicating strong spatial clustering.
Hot spots
| Cluster type | Block groups | Residents | Share that are OBCs | Average surface temp. vs. state (°C) |
|---|---|---|---|---|
| Hot spot (high–high) | 1,641 | 2.24 million | 89% | +10.7 |
| Cold spot (low–low) | 1,466 | 2.36 million | 26% | −0.4 |
| Outliers | 56 | 71,000 | — | — |
| Not significant | 3,263 | 4.55 million | 54% | +5.5 |
About 2.24 million people, 24% of New Jersey, live in statistically significant heat hot spots, and 91% of them live in overburdened communities, compared with 58% statewide. The largest hot-spot populations are in Newark (about 279,000 residents), Jersey City (224,000), Paterson (155,000), Elizabeth (134,000), Union City, Passaic, Clifton, Irvington, Bayonne, and North Bergen.
 Figure 1. A large connected heat hot spot covers the urban northeast, with smaller ones in Trenton, Camden and along the shore.
The map shows one enormous connected hot spot running through Hudson, Essex, Union, Passaic, and southern Bergen counties, plus smaller ones in Trenton, Camden, and along the shore. The cold spots are the forested Highlands, Pinelands, and rural northwest.
Why this matters
During a heat wave, one cooling center can’t serve a hot spot of 2 million people. The scale and connectedness of these clusters suggest heat response must be regional (coordinated across neighboring cities, transit agencies, and utilities), not just city by city. Long-term cooling, through trees, cool roofs, and less pavement, also has to happen across whole clusters to make a difference, since a single cool block surrounded by hot ones gains little. And because 9 in 10 hot-spot residents live in overburdened communities, heat adds to the cumulative burdens documented throughout this site.
Limitations
- Not the heat wave itself. Clouds blocked satellite views of July 2–6; I relied on stable June patterns.
- Few scenes. Most block groups had three clear June observations.
- Surface, not air, temperature, and mid-morning snapshots.
- Weights choice. Different definitions of “neighbor” (distance bands instead of shared borders) could change local results somewhat.
Code project (Level 5): spatial autocorrelation
Goal: Test whether heat clusters spatially and identify statistically significant hot spots.
Data: Landsat 8/9 Collection 2 Level-2, June 2026 (block-group surface temperature via common/lst.py); summer 2025 for stability; NJDEP EJ data (Mar 31, 2026 version).
Method:
- Compute block-group surface temperature anomalies from clear June 2026 pixels.
- Build queen contiguity weights with
libpysaland row-standardize them. - Compute global Moran’s I and local Moran’s I with 999 random permutations (
esda). - Label significant clusters (p < 0.05) and summarize residents and OBC shares.
from libpysal.weights import Queen
from esda.moran import Moran, Moran_Local
w = Queen.from_dataframe(g); w.transform = "r"
mi = Moran(g.lst_anom, w, permutations=999)
lisa = Moran_Local(g.lst_anom, w, permutations=999)    # lisa.q: 1=HH, 2=LH, 3=LL, 4=HL
New skills: spatial weights, permutation-based significance, and local versus global statistics.
Data and methods
Data sources
- Landsat 8/9 Collection 2 Level-2, June 2026 (block-group surface temperature via common/lst.py); summer 2025 for stability; NJDEP EJ data (Mar 31, 2026 version).
The analysis was done in Python with public data. The full code, its data, and every figure it produces are in the code project below.
References
- NBC New York. (2026, July 4). New Jersey reports 19 suspected heat deaths in first days of heat wave. https://www.nbcnewyork.com/new-jersey/new-jersey-heat-wave-deaths/6521567/
- PySAL developers. (n.d.). esda: Exploratory spatial data analysis. https://pysal.org/esda/
- The Watchers. (2026, July 7). New Jersey reports 29 suspected heat-related deaths after prolonged early July heat wave. https://watchers.news/2026/07/07/new-jersey-reports-29-suspected-heat-related-deaths-after-prolonged-early-july-heat-wave/
- U.S. Geological Survey. (2026). Landsat 8–9 Collection 2 Level-2 [Data set], via Microsoft Planetary Computer. https://planetarycomputer.microsoft.com/dataset/landsat-c2-l2
- New Jersey Department of Environmental Protection. (2026). Environmental Justice (EJ) Law Combined Stressor Summary (Current) [Data set]. https://www.arcgis.com/home/item.html?id=8f1eeb5074d147af8ab3e5e5a4f72d2b