
Peaker Plants on Hot Days: When the Heat Rises, So Does Power-Plant Pollution
Why hot days are different
When temperatures soar, air conditioners run nonstop and electricity demand peaks. To meet those peaks, grid operators turn on “peaker” plants, usually older gas- or oil-fired combustion turbines that sit idle most of the year. Peakers tend to be less efficient and less controlled than newer plants, so they can release more nitrogen oxides (NOx) for each unit of fuel burned. NOx is a key ingredient in ground-level ozone, which also peaks on hot days (my ozone trends post). Advocates have argued that peakers are often located in or near low-income communities and communities of color (Clean Energy Group, n.d.).
July 2026 brought a deadly heat wave to New Jersey, with 29 suspected heat-related deaths reported by the state health department (NJ Spotlight News, 2026). EPA’s detailed power plant data are published quarterly, about a month after each quarter ends, so as of late July the most recent complete summer was 2025, which included the record heat of June 22–25, 2025 (my satellite heat post).
Data
- Emissions: EPA’s Clean Air Markets Program Data (CAMPD), with daily NOx, heat input, and operating time for 81 New Jersey power plant units, May–September 2025 (U.S. EPA, n.d.-a).
- Temperature: NOAA daily maximum temperature at Newark Liberty International Airport (NOAA, n.d.).
- Location: each unit’s coordinates, matched to NJDEP’s overburdened community map.
I defined peakers as combustion turbines that operated on fewer than 25% of summer days: 13 units.
Findings
Hot days double power-plant NOx
On the 14 days when Newark reached 95°F or higher, New Jersey’s power plants emitted an average of 10.7 tons of NOx per day, twice the 5.3 tons on other summer days. The relationship isn’t a straight line: emissions stay fairly flat through the 80s and then climb steeply above about 90°F, which a LOWESS (locally weighted) smoothing curve shows clearly.
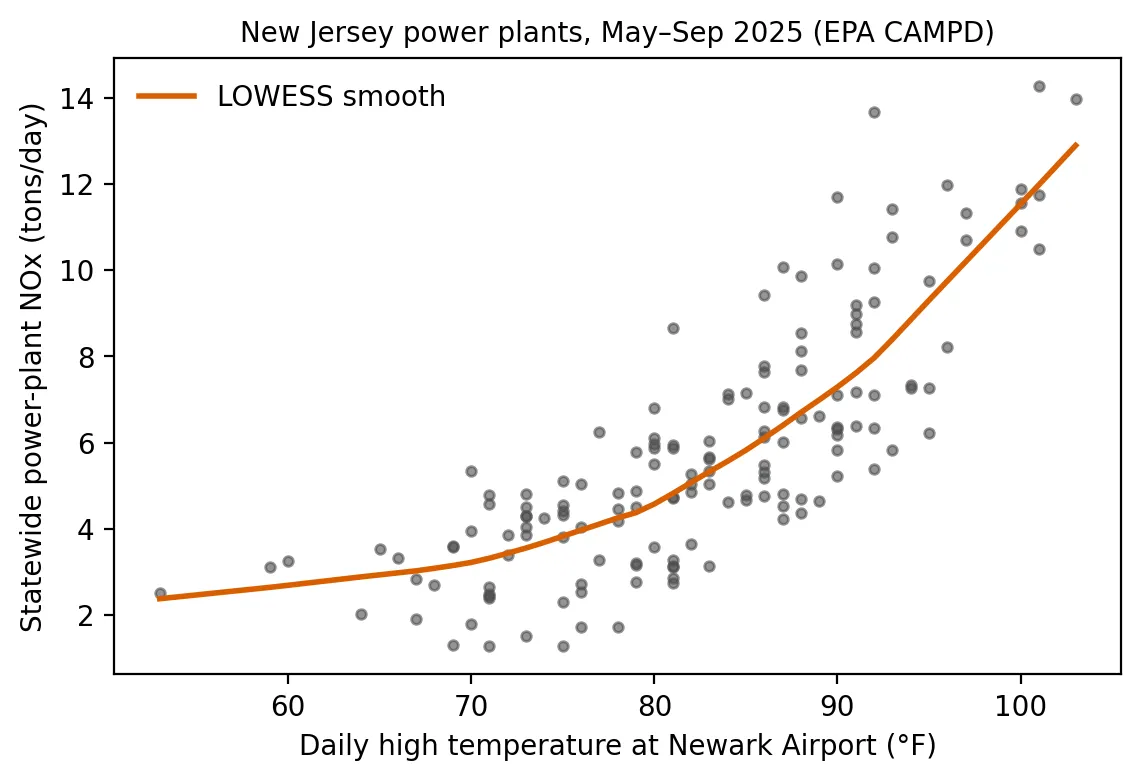 Figure 1. Power-plant NOx emissions rise steeply on the hottest days.
During the June 2025 heat wave, daily NOx rose from 7.1 tons on June 22 to 14.0–14.3 tons on June 24–25, when Newark hit 101–103°F.
 Figure 2. Daily NOx tracks Newark’s high temperature, with peaker plants adding the most on the hottest days.
Peakers switch on, and they’re dirtier
| Hot days (≥ 95°F) | Other days | |
|---|---|---|
| Peakers operating (average per day) | 5.6 | 1.5 |
| Peakers’ share of statewide power-plant NOx | 10% | 3% |
Peakers emitted about 0.073 lb of NOx per million BTU of fuel, roughly five times the rate of the other units (0.015). The median peaker began operating in 1989, compared with 2002 for other units. Peakers are a small share of total emissions, but their share triples on exactly the days when ozone is most likely to exceed health standards.
Where hot-day pollution is emitted
83% of all hot-day power-plant NOx came from units located inside overburdened communities, which reflects where New Jersey’s large gas plants sit (for example, the Newark and Linden areas; see my Ironbound power plant post). The peakers themselves were more spread out: only 23% of peaker hot-day NOx came from units in OBCs. So the hot-day burden in overburdened communities comes mostly from large plants running harder, not just from peakers.
Why this matters
On the hottest days, residents face high heat, high ozone, and maximum power-plant emissions all at once. People in overburdened communities, who often have less tree cover (my tree canopy post) and are three times as likely to live within three miles of a fuel-burning power plant (my power plant post), are most exposed. Policies to replace peakers with battery storage, expand demand response (paying customers to use less power at peak times), and improve building efficiency could cut emissions on exactly the days when they do the most harm.
Limitations
- One summer and one weather station. Newark’s temperature stands in for statewide demand. Regional grid conditions (PJM) also matter.
- Emissions are not concentrations. NOx released from a stack spreads and reacts in the air. Where a plant sits is not the same as where its pollution lands.
- Peaker definition. My “fewer than 25% of days” rule is a simple stand-in. Other definitions (capacity factor, age) could change which units count.
Code project (Level 5): emissions and weather
Goal: Measure how New Jersey power-plant NOx responds to hot days, and the role of peakers.
Data: EPA CAMPD apportioned daily unit emissions and unit attributes (via EPA’s API); NOAA GHCN-Daily maximum temperature for Newark Airport; NJDEP OBC list in effect on the cutoff date.
Method:
- Download daily unit data through the CAMPD streaming API and daily temperatures from NOAA’s data service.
- Classify units as peakers or not, and compute each unit’s NOx rate (tons → lb ÷ heat input).
- Sum to statewide daily totals and compare hot and other days.
- Fit a LOWESS curve of daily NOx against temperature to show the nonlinear relationship.
- Locate units in OBCs with a spatial join.
from statsmodels.nonparametric.smoothers_lowess import lowess
curve = lowess(daily.nox, daily.tmax, frac=0.5)       # smooth, nonlinear trend
rate = unit.nox_tons * 2000 / unit.heat_input_mmbtu    # lb NOx per MMBtu
New skills: working with APIs from two agencies, joining emissions to weather by date, and nonparametric smoothing.
Data and methods
Data sources
- EPA CAMPD apportioned daily unit emissions and unit attributes (via EPA's API); NOAA GHCN-Daily maximum temperature for Newark Airport; NJDEP OBC list in effect on the cutoff date.
The analysis was done in Python with public data. The full code, its data, and every figure it produces are in the code project below.
References
- Clean Energy Group. (n.d.). Phase out peakers. https://www.cleanegroup.org/initiatives/phase-out-peakers/
- NOAA National Centers for Environmental Information. (n.d.). GHCN-Daily station detail: Newark Liberty International Airport (USW00014734) [Data set]. https://www.ncei.noaa.gov/cdo-web/datasets/GHCND/stations/GHCND:USW00014734/detail
- U.S. Environmental Protection Agency. (n.d.-a). Clean Air Markets Program Data (CAMPD). https://campd.epa.gov/
- U.S. Environmental Protection Agency. (n.d.-b). Clean Air Markets. https://www.epa.gov/airmarkets
- NJ Spotlight News. (2026, July). Heat-related deaths spike in NJ during record temperatures. https://www.njspotlightnews.org/2026/07/heat-related-deaths-spike-in-nj-during-record-temperatures/
- Patch. (2025, June 26). Newark ties its record highest temperature during NJ heatwave. https://patch.com/new-jersey/newarknj/newark-ties-its-record-highest-temperature-during-nj-heatwave
- New Jersey Department of Environmental Protection. (2026). Environmental Justice (EJ) Law Combined Stressor Summary (Current) [Data set]. https://www.arcgis.com/home/item.html?id=8f1eeb5074d147af8ab3e5e5a4f72d2b