
Back to School Next to the Highway
Why schools?
Most of my posts have studied neighborhoods. But children spend about seven hours a day, 180 days a year, at school, often breathing harder during recess and gym. Air pollution is highest close to busy highways and drops off sharply within a few hundred feet (U.S. EPA, n.d.). California’s air agency recommends not siting schools within 500 feet of a freeway (California Air Resources Board, 2005), and many studies use 1,000 feet as a wider near-road zone.
As New Jersey students head back to school in late August 2026, I asked: how many attend school right next to a major highway, and are they disproportionately low-income?
Data
- Schools: the National Center for Education Statistics’ 2024–25 Public School Characteristics file, posted in May 2026, with each school’s location, enrollment, race/ethnicity, and number of students eligible for free or reduced-price lunch (FRL), a common measure of family income (NCES, 2026). I kept 2,503 open, in-person schools enrolling 1.36 million students.
- Highways: Census Bureau TIGER/Line 2025 primary roads, meaning limited-access highways such as the interstates, the Turnpike, the Garden State Parkway, and expressways (U.S. Census Bureau, 2025).
Findings
About 100,000 students
| Distance to nearest limited-access highway | Schools | Students | % of NJ students |
|---|---|---|---|
| Within 500 ft | 49 | 27,346 | 2.0% |
| Within 1,000 ft | 163 | 100,859 | 7.4% |
Most of the 163 near-highway schools are elementary schools (92), the youngest and most vulnerable students. The largest numbers of near-highway students are in Newark (13,071), Jersey City (9,290), Passaic (5,139), Paterson (4,789), Trenton (4,570), Irvington (4,470), Elizabeth (3,541), and East Orange (2,659).
Poorer schools are closer to highways
| School’s FRL quartile | % of schools within 1,000 ft of a highway |
|---|---|
| Q1 (lowest-income students) | 2.3% |
| Q2 | 5.2% |
| Q3 | 7.7% |
| Q4 (highest-income need) | 10.9% |
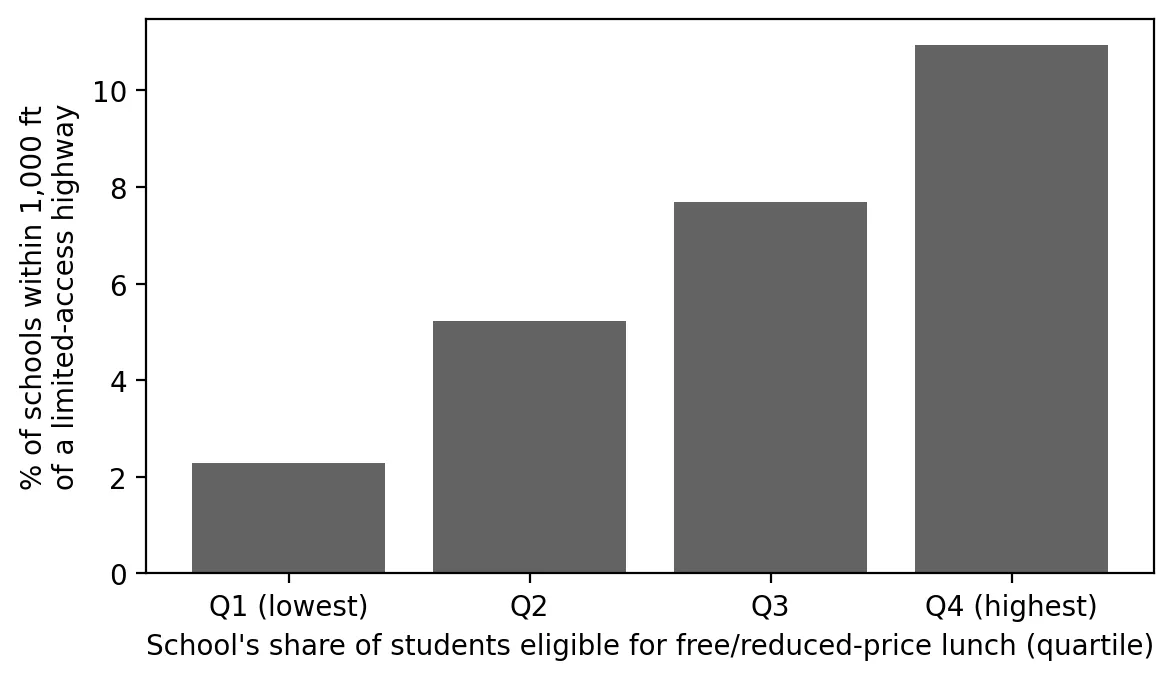 Figure 1. Schools with more low-income students are more likely to sit near a highway.
Schools in the highest-poverty quartile are almost five times as likely to sit within 1,000 feet of a highway as those in the lowest. Near-highway schools average 56% FRL students, compared with 40% elsewhere. Schools in overburdened communities are three times as likely to be near a highway (9.5% vs. 3.2%).
Testing it more carefully
Is this just because cities have both more highways and more low-income students? I used logistic regression, which models the odds of a yes/no outcome (near a highway or not):
| Model | Odds ratio per +10 points FRL | 95% CI |
|---|---|---|
| FRL only | 1.22 | 1.13–1.32 |
| + county fixed effects | 1.14 | 1.04–1.24 |
| + county fixed effects + % Black/Hispanic | 1.02 | 0.84–1.24 |
Comparing schools within the same county, each 10-point increase in FRL still raises the odds of being near a highway by about 14%. Standard errors are clustered by county, which accounts for the fact that schools in the same county aren’t fully independent.
I also ran a permutation test: shuffle FRL percentages randomly among schools within each county 2,000 times and see how often the near/not-near gap is as large as the real one. It almost never was (p = 0.0005), so the gap isn’t a fluke.
 Figure 2. The real gap between near-highway and other schools is far larger than the gaps produced by random shuffling within counties.
The third model is a useful lesson. When I add the share of Black and Hispanic students, the FRL effect disappears, but so does any significant race effect. That’s because the two are so closely related across New Jersey schools (Spearman’s ρ = 0.87) that the model can’t separate them. This is called multicollinearity. It doesn’t mean neither matters. It means this data can’t tell which one matters more.
Why this matters
Schools are rarely moved, but commonly recommended ways to cut exposure include high-efficiency air filters in ventilation systems, locating air intakes and playgrounds on the side away from the road, vegetation barriers, and scheduling outdoor activities away from peak traffic times. New Jersey could use the list of 163 schools as a priority list for filtration upgrades. When new schools are planned, distance from highways could be part of site selection, as California recommends.
Limitations
- Distance is not measured exposure. Wind direction, sound walls, elevation, and traffic volume all matter.
- Only limited-access highways. Busy arterial roads and truck routes (my warehouse boom post) are not included, so near-road exposure is undercounted.
- School location points may not reflect where playgrounds or air intakes are.
- FRL as income. Some districts provide free meals to all students, which can blur FRL counts.
Code project (Level 6): schools as the unit of analysis
Goal: Measure how many New Jersey students attend school near limited-access highways and whether this differs by school poverty.
Data: NCES Public School Characteristics 2024–25 (via its ArcGIS REST service); TIGER/Line 2025 primary and secondary roads for New Jersey (MTFCC S1100); NJDEP OBC data.
Method:
- Query the NCES service for New Jersey schools; filter to open, in-person schools with enrollment.
- Compute each school’s distance to the nearest highway with a spatial index (
sindex.nearest). - Tabulate students within 500 and 1,000 ft, and near-highway shares by FRL quartile.
- Fit logistic regressions with county fixed effects and county-clustered standard errors.
- Run a within-county permutation test.
m = smf.logit("near ~ frl10 + C(county)", d).fit(cov_type="cluster", cov_kwds={"groups": county_codes})
np.exp(m.params["frl10"])                             # odds ratio per +10 points FRL
sh = d.groupby("county").pct_frl.transform(lambda x: rng.permutation(x.values))   # shuffle within county
New skills: changing the unit of analysis, odds ratios, clustered standard errors, permutation tests, and diagnosing multicollinearity.
Data and methods
Data sources
- NCES *Public School Characteristics 2024–25* (via its ArcGIS REST service); TIGER/Line 2025 primary and secondary roads for New Jersey (MTFCC S1100); NJDEP OBC data.
The analysis was done in Python with public data. The full code, its data, and every figure it produces are in the code project below.
References
- California Air Resources Board. (2005). Air quality and land use handbook: A community health perspective. https://ww2.arb.ca.gov/sites/default/files/2023-05/Land%20Use%20Handbook_0.pdf
- National Center for Education Statistics. (2026). Public school characteristics 2024–25 [Data set]. https://www.arcgis.com/home/item.html?id=b05af34a43c44a9b86ab45534e9f2724
- National Center for Education Statistics. (n.d.). EDGE: School locations & geoassignments. https://nces.ed.gov/programs/edge/Geographic/SchoolLocations
- U.S. Census Bureau. (2025). TIGER/Line shapefiles 2025: Primary and secondary roads, New Jersey [Data set]. https://www2.census.gov/geo/tiger/TIGER2025/PRISECROADS/
- U.S. Environmental Protection Agency. (n.d.). Research on near roadway and other near source air pollution. https://www.epa.gov/air-research/research-near-roadway-and-other-near-source-air-pollution
- New Jersey Department of Environmental Protection. (2026). Environmental Justice (EJ) Law Combined Stressor Summary (Current) [Data set]. https://www.arcgis.com/home/item.html?id=8f1eeb5074d147af8ab3e5e5a4f72d2b