
Piling Up: How Many Serious Hazards Does Each Neighborhood Face at Once?
Cumulative impacts go to court
New Jersey’s Environmental Justice Law is built on one idea: cumulative impacts. A single factory might meet every pollution standard, but a neighborhood with a factory, a highway, a Superfund site, a waste facility, and old lead-painted housing faces something much worse than any one of those alone. In July 2026, the New Jersey Supreme Court agreed to hear a challenge to NJDEP’s rules for applying the law (my Supreme Court post). The parties’ briefs are due by the end of September (Riker Danzig, 2026).
Earlier posts looked at one hazard at a time. This one asks the cumulative question directly: how many serious environmental hazards does each New Jersey neighborhood face at the same time, and who faces the most?
Data and method
I used 12 environmental indicators from EPA’s final public EJScreen data (version 2.32, saved on February 5, 2025; see my EJScreen post): fine particles, ozone, diesel exhaust, nitrogen dioxide, toxic air releases, traffic, lead paint risk, Superfund sites, chemical accident facilities, hazardous waste facilities, underground storage tanks, and industrial wastewater (U.S. EPA, 2024).
For each indicator, I counted a neighborhood as facing a serious hazard if it is in New Jersey’s worst 20%. Each neighborhood then gets a score from 0 to 12. If hazards were spread randomly, the average neighborhood would face about 2.4 of them, and few would face many.
Findings
Overburdened communities face hazards stacked on hazards
| Overburdened communities | Other neighborhoods | |
|---|---|---|
| Average number of serious hazards (out of 12) | 3.5 | 1.0 |
| Facing none | 21% | 55% |
| Facing 5 or more | 33% | 4% |
| Facing 7 or more | 20% | 2% |
| Residents facing 5 or more | 1.72 million | 132,000 |
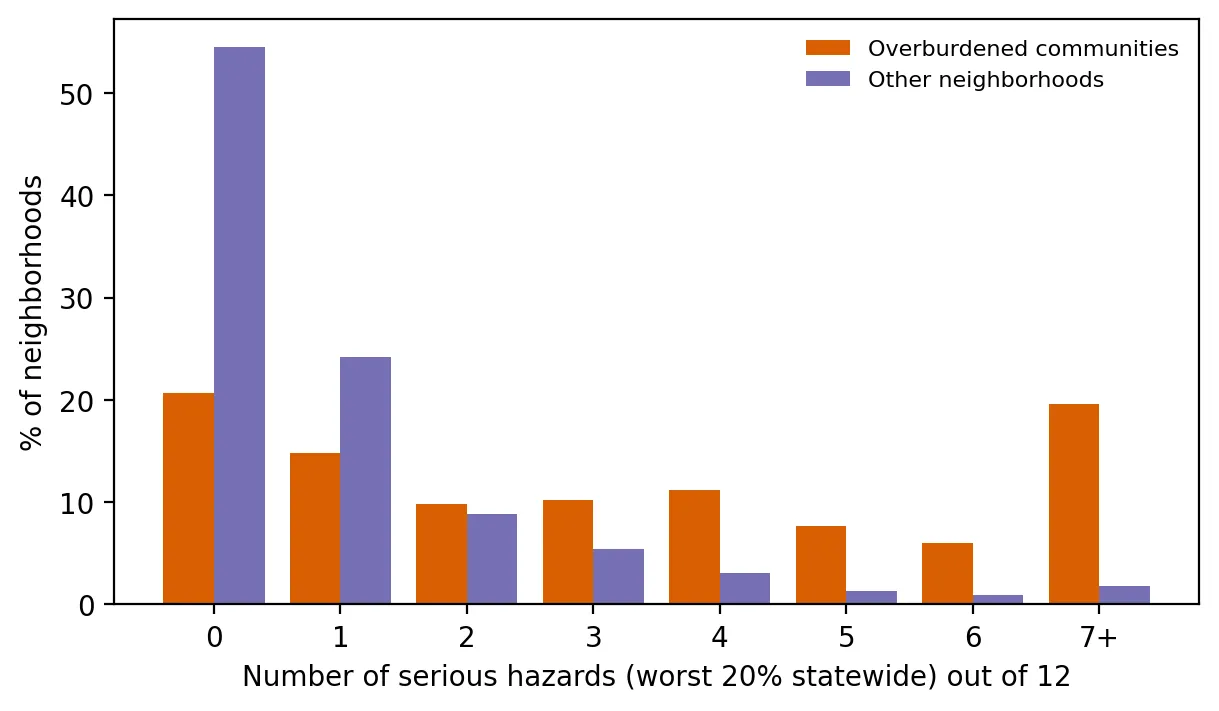 Figure 1. Overburdened communities face many more serious hazards at once than other neighborhoods.
More than half of other neighborhoods face no serious hazards at all. Meanwhile, one in three overburdened communities faces five or more at once, and one in five faces seven or more. About 93% of New Jerseyans living with five or more serious hazards live in overburdened communities.
Testing it
Count models. Because the outcome is a count (0, 1, 2, …), I used count regression models. A Poisson model is the standard starting point, and a negative binomial model allows for extra variation (the Poisson deviance ratio was 1.37, so some extra variation was present). Comparing neighborhoods within the same county, overburdened communities face 2.1 times as many serious hazards (95% CI 1.7–2.6, p < 0.001).
Cluster bootstrap. Resampling whole counties 500 times gave a 95% confidence interval of 1.6 to 2.6 for that ratio. However the counties are reshuffled, overburdened communities face substantially more hazards.
A dose-response curve. A spline is a flexible curve that lets the data show their own shape instead of forcing a straight line. Within a typical county, the predicted number of serious hazards climbs from about 2.5 in neighborhoods with 5–25% people of color to 4.2 at 50%, 5.6 at 75%, and 6.8 at 95%.
 Figure 2. Predicted hazards climb as a neighborhood’s share of people of color increases.
A cross-check with the state’s own measure. My hazard count is positively correlated with NJDEP’s Combined Stressor Total, which uses different data and methods (r = 0.53). Two independent approaches point to the same neighborhoods.
What this shows
Environmental injustice in New Jersey isn’t just about one bad facility. It’s about burdens piling up in the same places. About 1.7 million residents of overburdened communities live with five or more serious hazards at once. That is precisely the situation the Environmental Justice Law’s cumulative-impact test was designed to recognize, and it is what the Supreme Court case will ultimately decide how to handle.
Limitations
- Equal weights. Each hazard counts the same, though some are more harmful than others.
- The “worst 20%” cutoff is a choice. Other cutoffs would change the counts but not the pattern.
- Data age. EJScreen’s indicators predate its February 2025 removal.
Code project (Level 6): cumulative counts and count models
Goal: Count how many serious hazards each neighborhood faces and test whether overburdened communities face more, within the same county.
Data: EJScreen 2.32 New Jersey block groups (Internet Archive copy, February 5, 2025); NJDEP EJ data (version effective March 31, 2026).
Steps:
- Flag each indicator in the worst 20% statewide and add up the flags (0–12).
- Compare distributions for overburdened and other neighborhoods.
- Check overdispersion; fit Poisson and negative binomial models with county fixed effects.
- Cluster-bootstrap the rate ratio by resampling counties.
- Fit a spline in % people of color to draw a dose-response curve.
d["n_hazards"] = sum((d[c] >= d[c].quantile(0.8)).astype(int) for c in ENV)
nb = smf.glm("n_hazards ~ obc + C(COUNTY)", d, family=sm.families.NegativeBinomial(alpha=0.5)).fit()
sp = smf.glm("n_hazards ~ bs(poc, df=4) + C(COUNTY)", d, family=sm.families.Poisson()).fit()   # spline curve
New skills: building a cumulative index, choosing between count models, splines, and bootstrapping a model coefficient.
Data and methods
Data sources
- EJScreen 2.32 New Jersey block groups (Internet Archive copy, February 5, 2025); NJDEP EJ data (version effective March 31, 2026).
The analysis was done in Python with public data. The full code, its data, and every figure it produces are in the code project below.
References
- New Jersey Department of Environmental Protection. (2026). Environmental Justice (EJ) Law Combined Stressor Summary (Current) [Data set]. https://www.arcgis.com/home/item.html?id=8f1eeb5074d147af8ab3e5e5a4f72d2b
- New Jersey Legislature. (2020). P.L.2020, c.92. https://pub.njleg.gov/bills/2020/PL20/92_.PDF
- Riker Danzig. (2026, September 3). New Jersey Supreme Court to review NJDEP's environmental justice rules. https://riker.com/blog/environmental-law/new-jersey-supreme-court-to-review-njdeps-environmental-justice-rules/
- U.S. Environmental Protection Agency. (2024). EJScreen 2.32 block group data with state percentiles [Data set; Internet Archive copy of February 5, 2025]. https://web.archive.org/web/20250205213739/https://gaftp.epa.gov/ejscreen/2024/2.32_August_UseMe/EJSCREEN_2024_BG_StatePct_with_AS_CNMI_GU_VI.csv.zip