
Can Open Data Map New Jersey's Warehouses? A Lesson in Data Gaps and Spatial Bias
The problem
In my warehouse boom post, I studied the warehouse boom through NJDEP’s truck traffic data, because New Jersey has no free, public map of warehouse locations. Commercial real estate databases exist, but they cost money. Advocates have argued that warehouses cluster near overburdened communities. A 2024 report estimated that about one in three New Jerseyans lives within half a mile of a large warehouse (Environmental Defense Fund, 2024). Could a free, crowd-sourced map, OpenStreetMap (OSM), fill the gap?
This post is partly about warehouses and partly about a research skill: checking whether your data are good enough before trusting the results.
Getting the data “as of” the cutoff
OSM changes every minute as volunteers edit it. To avoid hindsight, I used the Overpass API’s historical query feature, which returns the map exactly as it existed on October 8, 2026 (fetch_query.txt). I downloaded every building tagged warehouse (1,065) or industrial (2,372) in New Jersey and kept those with footprints of at least 50,000 square feet: 1,396 large buildings covering 326 million square feet.
Step 1: is the data complete?
A Rutgers study (reported in November 2025) counted about 1.02 billion square feet of warehouse space in New Jersey buildings of 20,000 square feet or more (NJBIZ, 2025). Buildings tagged warehouse in OSM add up to only about 21% of that total. Even including large industrial buildings, OSM captures roughly a third.
OSM coverage is also uneven. Middlesex County has 98 million square feet of large tagged buildings, more than three times any other county. That’s plausible given the Turnpike’s Exit 8A–12 logistics corridor, but it also likely reflects where volunteers have mapped in detail. Many large warehouses elsewhere are simply tagged building=yes.
Lesson: incomplete data isn’t useless, but its gaps can be biased. If mapping is more complete in some places than others, comparisons between places can be misleading. I treat the results below as a lower bound and a test of methods, not a final count.
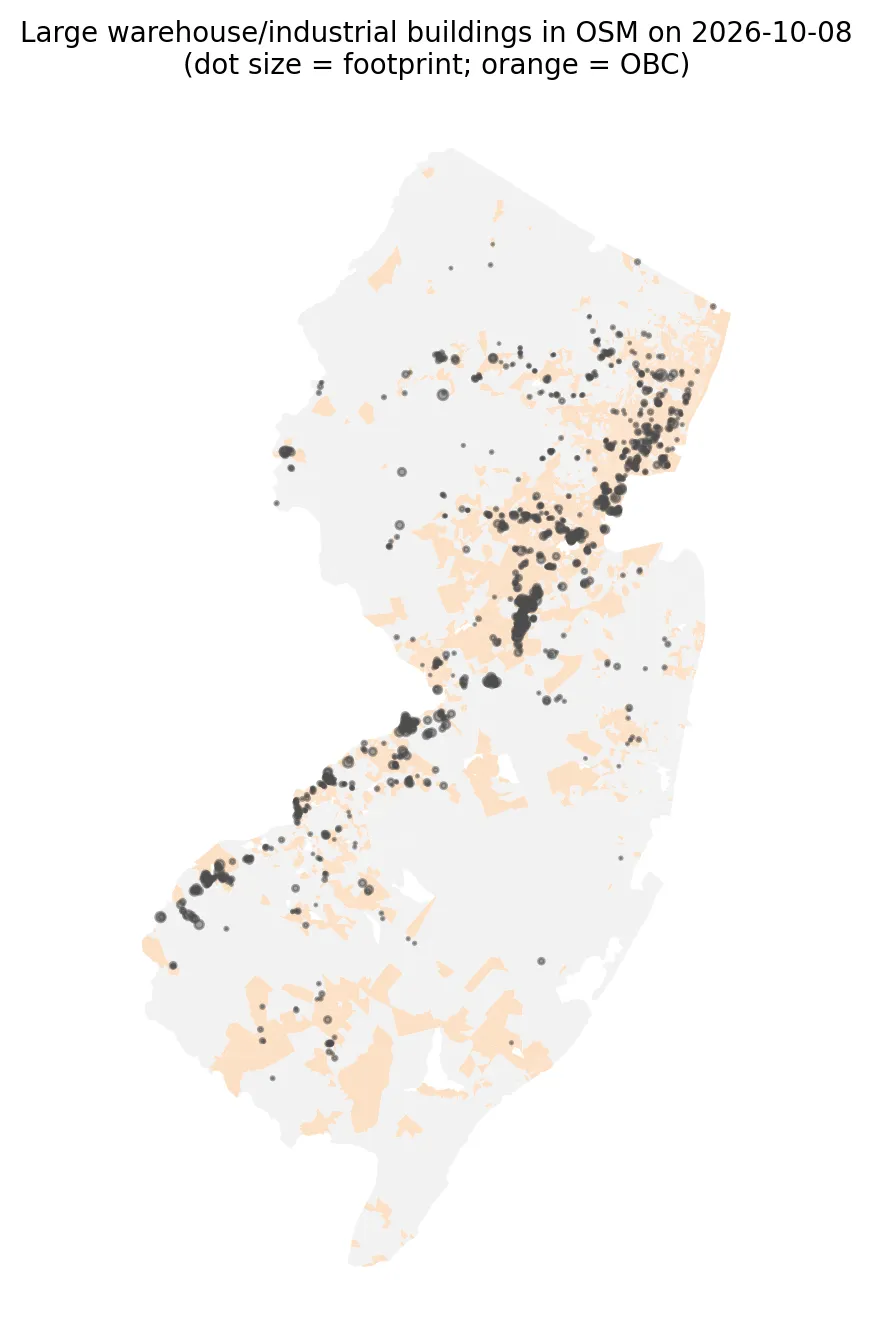 Figure 1. Large warehouse and industrial buildings mapped in OpenStreetMap, shown over overburdened communities.
Step 2: who lives near the mapped buildings?
| Overburdened communities | Other block groups | |
|---|---|---|
| Large warehouse/industrial building within ½ mile | 19% | 5% |
| Average large-building footprint within ½ mile | 70,000 sq ft | 20,000 sq ft |
About 1.2 million residents (13%) live within half a mile of at least one mapped large warehouse or industrial building. That’s well below the one-in-three estimate, which is consistent with OSM missing most warehouses. Even in this incomplete data, though, overburdened block groups are almost four times as likely to be near one.
Step 3: a regression that accounts for geography
I regressed each block group’s (log) nearby warehouse footprint on its minority share, low-income share, and impervious surface (a proxy for urban development). The ordinary regression (OLS) found that a 10-point higher minority share was associated with more nearby warehouse space, with a very small standard error.
But there’s a problem. Using Moran’s I from my July heat wave post, the residuals (the part the model can’t explain) were strongly clustered: Moran’s I = 0.38, p = 0.001. Neighboring block groups share unexplained warehouse exposure, so they aren’t independent observations. OLS then treats the data as if it had more independent information than it really does, making results look more certain than they are.
A spatial error model fixes this by letting each block group’s error be related to its neighbors’ errors:
| Variable (+10 points) | OLS coefficient (SE) | Spatial error model (SE) |
|---|---|---|
| Minority % | 0.025 (0.002) | 0.012 (0.003) |
| Low-income % | 0.000 (0.004) | 0.003 (0.003) |
| Impervious surface % | 0.014 (0.003) | 0.015 (0.004) |
| Spatial error parameter (λ) | — | 0.67 |
 Figure 2. Accounting for spatial dependence cuts the minority-share association roughly in half.
After accounting for spatial dependence, the minority-share association is cut in half but remains clearly positive. Low income shows no independent association once minority share and urbanization are included. The strong λ (0.67) confirms that location explains a lot of warehouse exposure that the three variables don’t.
What this means
- Warehouses do cluster near overburdened communities, even in incomplete open data and even after correcting for spatial dependence.
- Open data need checking. OSM captured maybe a fifth to a third of New Jersey’s warehouse space, unevenly. A public, official warehouse inventory, which some states and regional planning agencies have built, would make this kind of analysis much more reliable. Volunteers can also improve OSM directly by tagging large buildings correctly.
- Spatial data need spatial statistics. Ignoring spatial dependence overstated the minority-share effect by about two times.
Limitations
- Coverage bias, discussed above, is the main limitation.
- Footprint isn’t floor area, and
industrialbuildings include factories as well as warehouses. - Proximity, not truck traffic. Warehouse impacts depend on truck trips, which my warehouse boom post measured directly.
- Model choice. A spatial lag model, or different neighbor definitions, could give somewhat different estimates.
Code project (Level 6): time-traveled open data and spatial regression
Goal: Build an as-of-date warehouse dataset from OpenStreetMap, check its completeness, and test whether warehouse exposure is associated with community characteristics after accounting for spatial dependence.
Data: OpenStreetMap buildings tagged warehouse or industrial as of 2026-10-08 (Overpass API, © OpenStreetMap contributors, ODbL); NJDEP EJ data (Mar 31, 2026 version).
Method:
- Query Overpass with
[date:"2026-10-08T00:00:00Z"]to get the historical map. - Build polygons, compute footprints, and compare totals with an outside benchmark.
- Sum large-building footprints within ½ mile of each block group.
- Fit OLS, then test residuals with Moran’s I.
- Fit a maximum-likelihood spatial error model (
spreg.ML_Error) and compare coefficients.
mi = Moran(ols.resid.values, w, permutations=999)        # are residuals spatially clustered?
err = ML_Error(y, X, w=w, name_x=["minority10", "lowinc10", "imperv10"])
err.betas, err.std_err                                     # spatially corrected estimates
New skills: historical queries for reproducibility, data-quality benchmarking, and spatial regression.
Data and methods
Data sources
- OpenStreetMap buildings tagged warehouse or industrial as of 2026-10-08 (Overpass API, © OpenStreetMap contributors, ODbL); NJDEP EJ data (Mar 31, 2026 version).
The analysis was done in Python with public data. The full code, its data, and every figure it produces are in the code project below.
References
- Environmental Defense Fund. (2024, June 14). New Jersey's warehouse boom [Report]. https://cleanwater.org/sites/default/files/2024-06/NJ-Warehouse-Boom-Report-EDF-6-14-2024.pdf
- NJBIZ. (2025, November). NJ warehouses drive $295.8B economic impact. https://njbiz.com/nj-warehouses-distribution-centers-economic-impact/
- OpenStreetMap contributors. (2026). OpenStreetMap [Data set, as of October 8, 2026, via the Overpass API]. https://www.openstreetmap.org/copyright
- Overpass API. (n.d.). Overpass QL: Date (attic) queries. https://wiki.openstreetmap.org/wiki/Overpass_API/Overpass_QL#date
- PySAL developers. (n.d.). spreg: Spatial regression. https://pysal.org/spreg/
- New Jersey Department of Environmental Protection. (2026). Environmental Justice (EJ) Law Combined Stressor Summary (Current) [Data set]. https://www.arcgis.com/home/item.html?id=8f1eeb5074d147af8ab3e5e5a4f72d2b