
Toxic Tides: When Rising Seas Meet New Jersey's Contaminated Sites
Abstract. New Jersey has about 12,600 known contaminated sites, from leaking heating-oil tanks to federal Superfund sites. As sea levels rise, floodwater can reach some of them, potentially spreading pollution that is currently contained. In my NJ Toxic Tides project, I identified 1,306 sites where land within 100 meters is dry today but would flood with 3 feet of sea-level rise, a level within New Jersey’s likely range for 2100. Residents of overburdened communities are about three times as likely as other New Jerseyans to live within a kilometer of one of these sites. For this post, I re-tested both headline findings with the state’s March 2026 overburdened community list and finer census-block population data. The results held: a within-county odds ratio of 1.70 (originally 1.78) and a residential disparity of 2.99 times (originally 3.06). The disparity does not appear in today’s FEMA floodplains or at 1 foot of sea-level rise. It emerges as the sea rises, which means today’s flood maps understate where future risk will concentrate.
1. A legacy in the flood zone
Many of New Jersey’s industries were built on the water. Rivers and bays provided shipping, cooling water, and, for much of the 20th century, a convenient place to discharge waste. The result is a coastline and riverfront lined with former factories, rail yards, chemical plants, and fuel terminals. Many of these properties are on NJDEP’s Known Contaminated Sites List, which includes about 12,600 sites where soil or groundwater contamination exceeds state standards. Some are still being cleaned up; others have finished active cleanup but rely on caps, fences, or deed restrictions to keep contamination in place.
Those engineered controls assume the land stays dry. Flooding can erode caps, raise groundwater, and mobilize contaminants into neighborhoods and waterways. New Jersey’s Science and Technical Advisory Panel projects that sea levels along the state’s coast will likely rise 0.9 to 1.7 feet by 2050 and 2.2 to 3.8 feet by 2100 under intermediate emissions (NJ STAP, 2025). In coastal California, Cushing et al. (2023) found that hazardous sites threatened by sea-level rise are disproportionately located near socially vulnerable communities. I wanted to know whether the same was true in New Jersey, using the state’s own contaminated site inventory and its environmental justice law.
2. Methods in brief
The full pipeline is documented in the NJ Toxic Tides repository; the update analysis for this post is in code/.
- Contaminated sites. NJDEP’s Known Contaminated Sites List (12,600 sites, pulled October 2026).
- Sea-level rise. NOAA’s sea-level rise inundation layers for New Jersey, in 1-foot increments above high tide. These are static “bathtub” models with no storm surge.
- Exposure. A site counts as exposed if land within 100 meters that is dry today floods at a given sea level. An early version of the analysis counted any site near today’s water as “exposed,” which flagged every waterfront site. I corrected that by excluding areas already under water.
- Overburdened communities. Originally, I used NJDEP’s 2010-geography OBC layer, which did not line up perfectly with 2020 census block groups. For this update, I used NJDEP’s March 2026 OBC list, which is built on 2020 block groups (see Post 1).
- Statistics. At the site level, I compared exposed and unexposed sites within the same county (a Mantel–Haenszel odds ratio), so the result is not driven by differences between counties. At the population level, I counted residents within 1 km of an exposed site.
3. Results
1,306 sites, and three times the exposure for overburdened residents
At 3 feet of sea-level rise, 1,306 contaminated sites have newly flooded land within 100 meters. They include 10 federal Superfund sites, among them Riverside Industrial Park in Newark, Standard Chlorine in Kearny, Chemical Control Corporation in Elizabeth, and the Berry’s Creek drainage basin in the Meadowlands.
Using the March 2026 OBC list and 2020 census-block population:
| Living within 1 km of a site threatened by 3 ft of sea-level rise | |
|---|---|
| Residents of overburdened communities | 24.3% (about 1.30 million people) |
| Other residents | 8.2% (about 323,000 people) |
| Ratio | 2.99 (95% CI 2.65–3.40) |
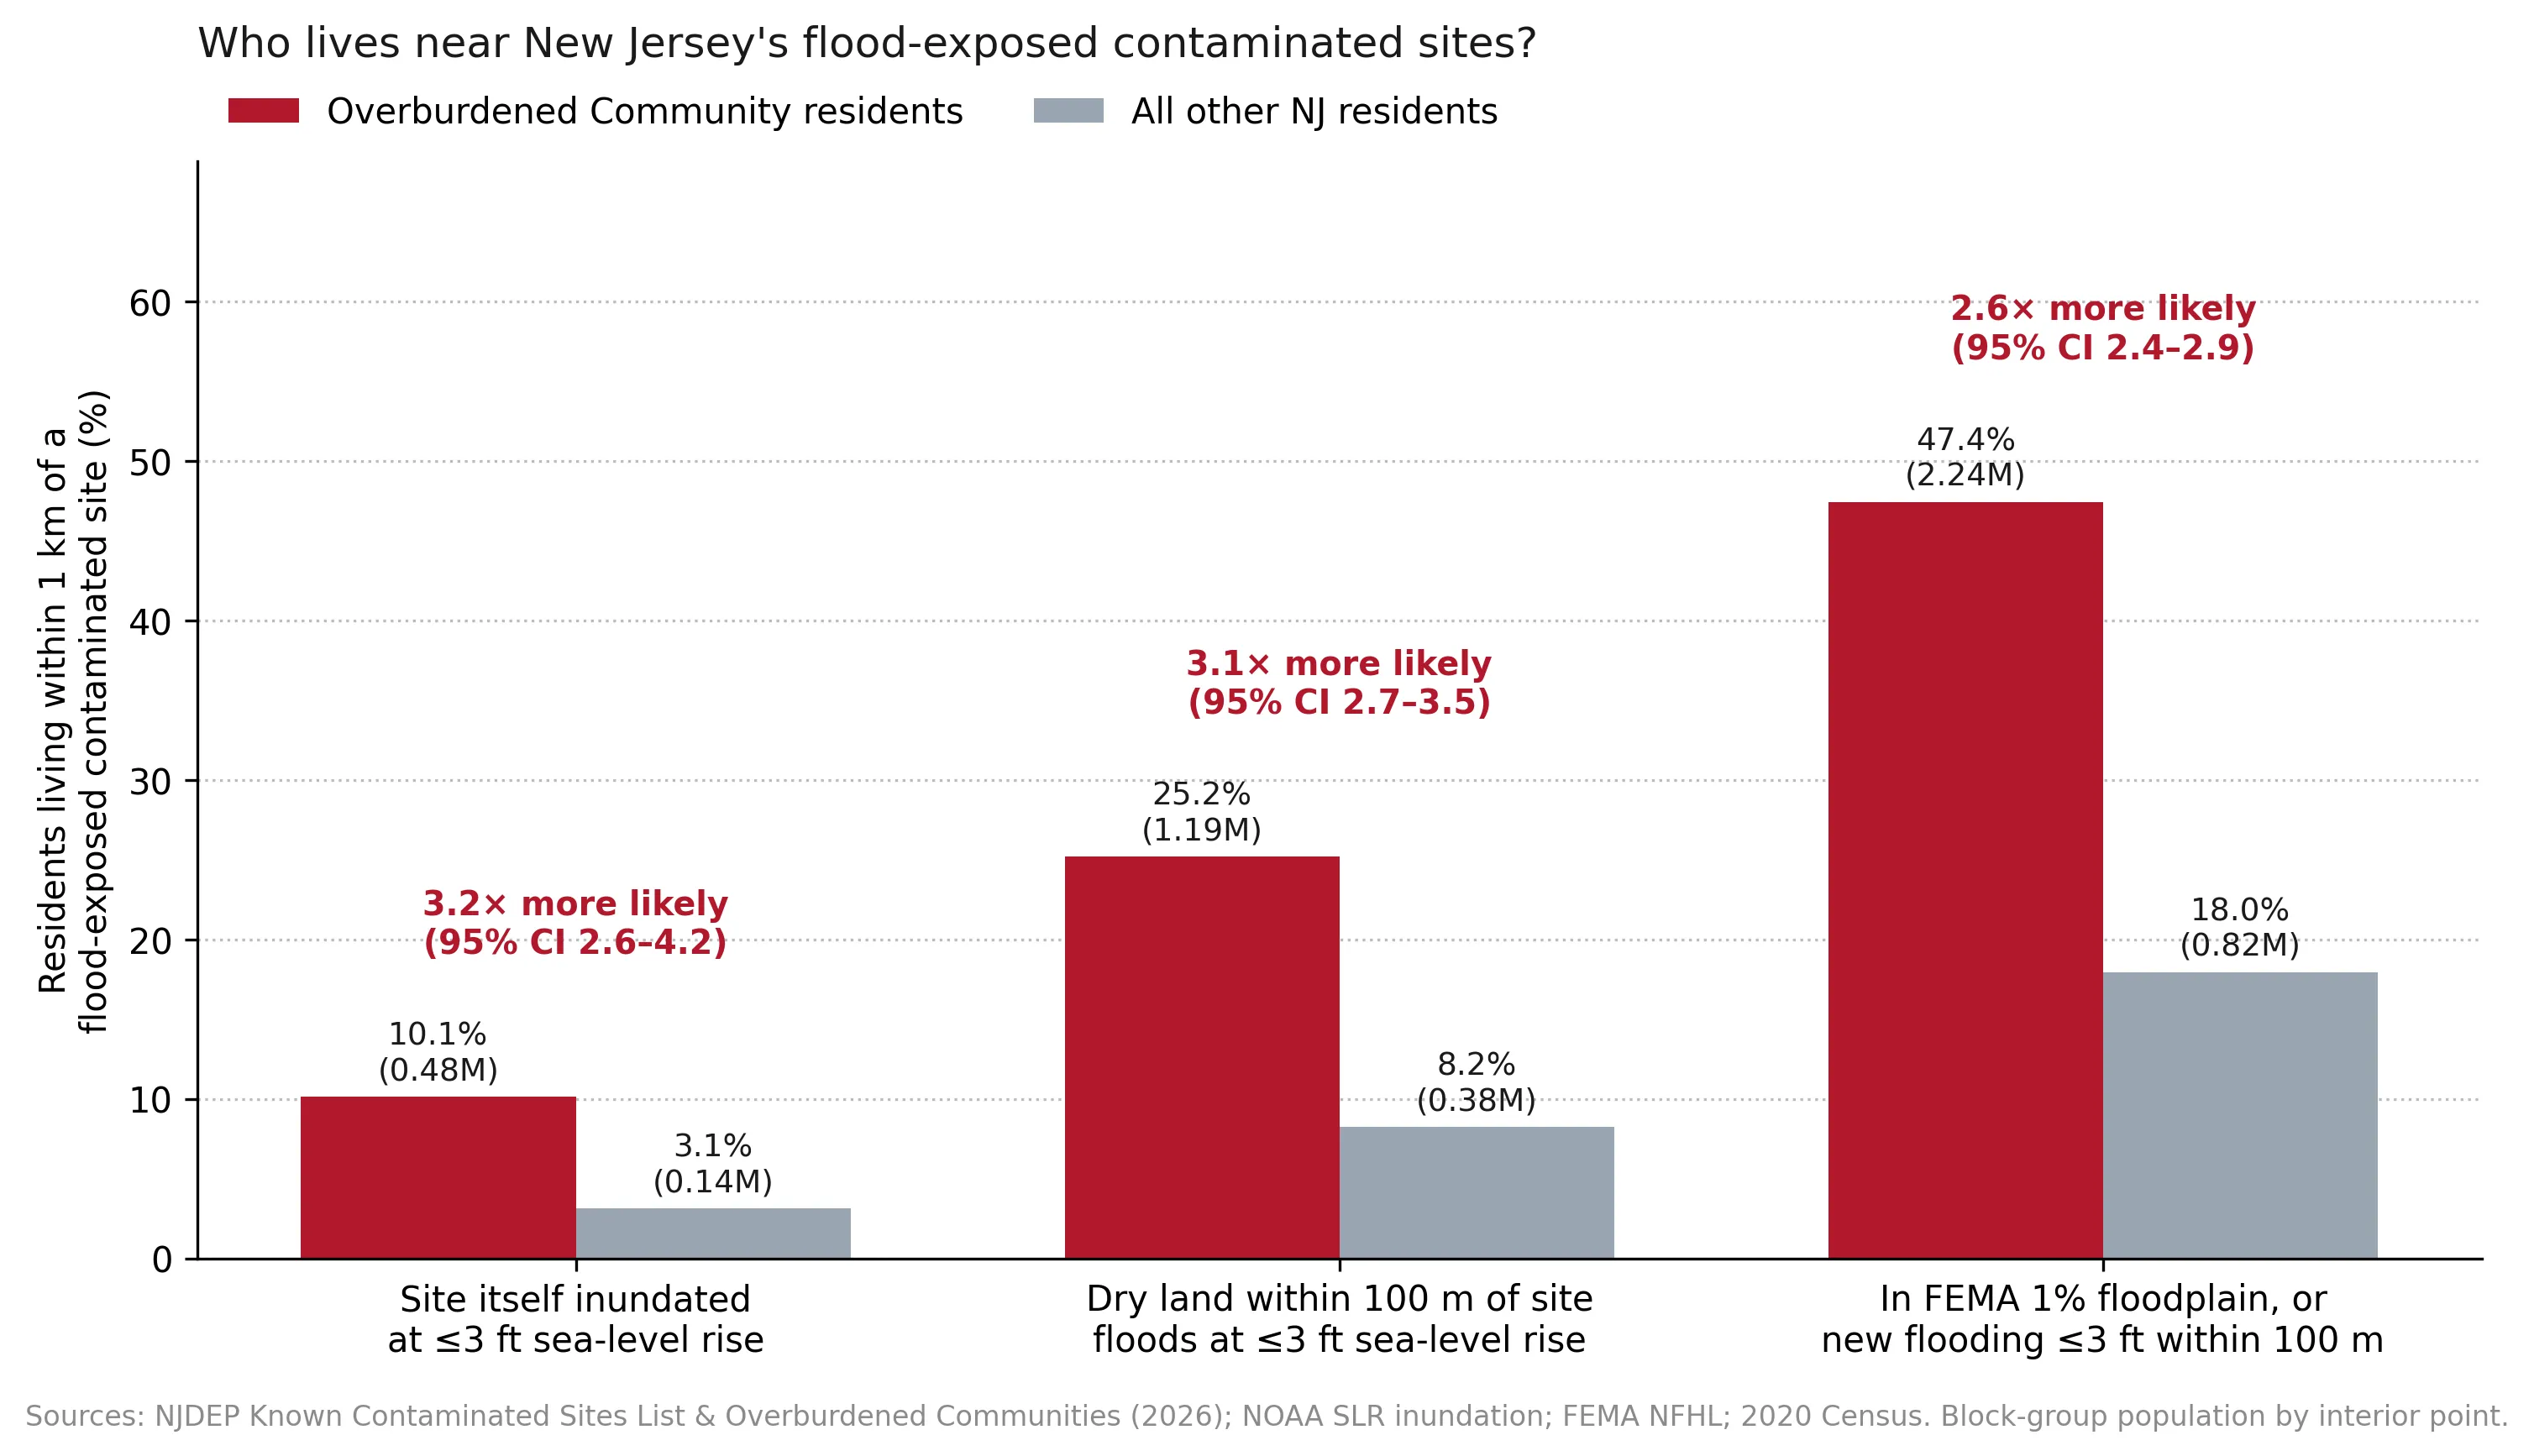 Figure 2 (original analysis). Share of residents living within 1 km of a contaminated site exposed under each definition, by overburdened community status.
The disparity grows as the sea rises
Comparing sites within the same county, a site exposed at 3 feet is substantially more likely to be in an overburdened community than an unexposed site. At 1 foot, there is no disparity. The pattern holds with both the original and the updated OBC data:
| Sea-level rise | Exposed sites | % in OBC (exposed vs. not) | Within-county odds ratio, March 2026 OBC list | Original (2010-geography OBC layer) |
|---|---|---|---|---|
| ≤ 1 ft | 455 | 65.1% vs. 66.4% | 1.01 [0.81–1.27] | 1.05 [0.85–1.30] |
| ≤ 2 ft | 785 | 69.3% vs. 66.1% | 1.37 [1.14–1.65] | 1.27 [1.07–1.50] |
| ≤ 3 ft | 1,306 | 73.3% vs. 65.5% | 1.70 [1.46–1.98] | 1.78 [1.54–2.05] |
 Figure 3. Within-county odds ratios at 1, 2, and 3 feet of sea-level rise, using the original and the March 2026 OBC data.
This pattern has a clear interpretation. The contaminated sites nearest today’s water, including many in wealthier shore communities, are spread across all kinds of neighborhoods. As the sea rises, floodwater reaches further inland into the industrial river corridors of places like Camden, Kearny, Newark, Jersey City, and Atlantic City, where overburdened communities are concentrated. Today’s FEMA 1% annual-chance floodplains show no comparable disparity (within-county odds ratio 0.84 in the original analysis), which means current flood maps miss where future risk is concentrated.
Robust to the data update
The March 2026 OBC list changed the status of about 16% of contaminated sites compared with the older layer, and it uses population counts for 138,000 census blocks instead of about 6,600 block-group centroids. Both headline results barely moved (1.78 → 1.70; 3.06 → 2.99). This kind of check matters because environmental justice findings can depend heavily on which boundaries and definitions are used. A result that survives a change in the underlying community definitions is more trustworthy.
Camden as a case study
Camden has 243 contaminated sites, and 70 of them are exposed at 3 feet, all in overburdened communities. Fourteen are exposed at just 1 foot, a level within the 2050 projection range. About 70% of Camden residents live within a kilometer of one of these sites. The exposed sites follow the Delaware River waterfront and the Cooper River and Newton Creek corridors (Figure 4). I summarized these findings in a two-page policy brief for Camden stakeholders.
 Figure 4 (original analysis). Contaminated sites in Camden exposed to sea-level rise.
4. What this means for policy
New Jersey has begun to plan for sea-level rise. NJDEP’s 2026 Resilient Environments and Landscapes (REAL) rules raise standards for new development in flood-prone areas. But most of the risk identified here comes from existing contamination: sites that were remediated, capped, or restricted under the assumption that they would stay dry. Three steps follow from the analysis:
- Re-evaluate remedies at exposed sites. Caps and deed restrictions approved decades ago should be reviewed against current sea-level projections, starting with sites exposed at 1–2 feet.
- Use future flood maps, not just FEMA maps. Because FEMA floodplains do not show the disparity, programs that rely only on current flood maps will underinvest in the communities most at risk.
- Connect climate and environmental justice programs. Flooding is already one of the 26 stressors in NJDEP’s environmental justice framework, but it is measured using current conditions. Adding projected flooding of contaminated sites would better reflect the cumulative risk that overburdened communities face.
5. Limitations
- Screening level. This analysis identifies where flooding and contamination overlap. It does not predict that a particular site will release contamination; that depends on the contaminants, the remedy, and site-specific conditions.
- Approximate locations. Site coordinates are often address points, not property boundaries.
- Bathtub model. NOAA’s layers show permanent inundation only. Storm surge on top of higher seas would reach more sites, so these counts are a lower bound.
- Sites are not independent. Contaminated sites cluster in industrial corridors, so confidence intervals are somewhat too narrow.
6. Conclusion
As sea levels rise, New Jersey’s industrial legacy will increasingly meet the water, and the communities nearest that meeting point are disproportionately overburdened ones. This disparity is not visible in today’s flood maps or at 1 foot of sea-level rise. It emerges at 2 to 3 feet, within the range projected for this century. Re-testing the analysis with updated community definitions and finer population data confirmed the finding. Planning for it now, while there is time to revisit remedies and target resilience investments, is far easier than responding after floodwater has already reached contaminated ground.
Data and methods
The analysis was done in Python with public data. The full code, its data, and every figure it produces are in the code project below.
References
- Cushing, L. J., Ju, Y., Kulp, S., Depsky, N., Karasaki, S., Jaeger, J., Raval, A., Strauss, B., & Morello-Frosch, R. (2023). Toxic tides and environmental injustice: Social vulnerability to sea level rise and flooding of hazardous sites in coastal California. Environmental Science & Technology, 57(19), 7370–7381. https://doi.org/10.1021/acs.est.2c07481
- New Jersey Department of Environmental Protection. (2026). Known Contaminated Sites List [Data set, pulled October 10, 2026]. https://mapsdep.nj.gov/arcgis/rest/services/Features/Environmental_NJEMS/MapServer/0
- New Jersey Department of Environmental Protection. (2026). Environmental Justice (EJ) Law Combined Stressor Summary (Current) [Data set].
- New Jersey Science and Technical Advisory Panel. (2025). New Jersey's rising seas and changing coastal storms: 2025 report. Rutgers University. https://njclimateresourcecenter.rutgers.edu/wp-content/uploads/2025/11/NJ-Rising-Seas-and-Changing-Coastal-Storms-Summary-FAQs-11-2025.pdf
- NOAA Office for Coastal Management. (n.d.). Sea level rise viewer data: New Jersey [Data set]. https://coast.noaa.gov/slrdata/
- U.S. Census Bureau. (2021). TIGER/Line shapefiles: 2020 tabulation blocks, New Jersey [Data set].